# Notes on performance measures during development
#### Commit 52fcb51f - Add basic random stealing
Slight improvement, needs further measurement after removing more important bottlenecks.
Below are three individual measurements of the difference.
Overall the trend (sum of all numbers/last number),
go down (98.7%, 96.9% and 100.6%), but with the one measurement
above 100% we think the improvements are minor.
| | | | | | | | | | |
| --- | --- | --- | --- | --- | --- | --- | --- | --- | --- |
old | 1659.01 us| 967.19 us| 830.08 us| 682.69 us| 737.71 us| 747.92 us| 749.37 us| 829.75 us| 7203.73 us
new | 1676.06 us| 981.56 us| 814.71 us| 698.72 us| 680.87 us| 737.68 us| 756.91 us| 764.71 us| 7111.22 us
change | 101.03 %| 101.49 %| 98.15 %| 102.35 %| 92.30 %| 98.63 %| 101.01 %| 92.16 %| 98.72 %
| | | | | | | | | | |
| --- | --- | --- | --- | --- | --- | --- | --- | --- | --- |
old | 1648.65 us| 973.33 us| 820.18 us| 678.80 us| 746.21 us| 767.63 us| 747.17 us| 1025.35 us| 7407.32 us
new | 1655.09 us| 964.99 us| 807.57 us| 731.34 us| 747.47 us| 714.71 us| 794.35 us| 760.28 us| 7175.80 us
change | 100.39 %| 99.14 %| 98.46 %| 107.74 %| 100.17 %| 93.11 %| 106.31 %| 74.15 %| 96.87 %
| | | | | | | | | | |
| --- | --- | --- | --- | --- | --- | --- | --- | --- | --- |
old | 1654.26 us| 969.12 us| 832.13 us| 680.69 us| 718.70 us| 750.80 us| 744.12 us| 775.24 us| 7125.07 us
new | 1637.04 us| 978.09 us| 799.93 us| 709.33 us| 746.42 us| 684.87 us| 822.30 us| 787.61 us| 7165.59 us
change | 98.96 %| 100.93 %| 96.13 %| 104.21 %| 103.86 %| 91.22 %| 110.51 %| 101.60 %| 100.57 %
#### Commit 3535cbd8 - Cache Align scheduler_memory
Big improvements of about 6% in our test. This seems like a little,
but 6% from the scheduler is a lot, as the 'main work' is the tasks
itself, not the scheduler.
This change unsurprisingly yields the biggest improvement yet.
#### Commit b9bb90a4 - Try to figure out the 'high thread bottleneck'
We are currently seeing good performance on low core counts
(up to 1/2 of the machines cores), but after that performance
plumishes:
Bana-Pi Best-Case:
 Bana-Pi Average-Case:
 Laptop Best-Case:
 Laptop Average-Case:
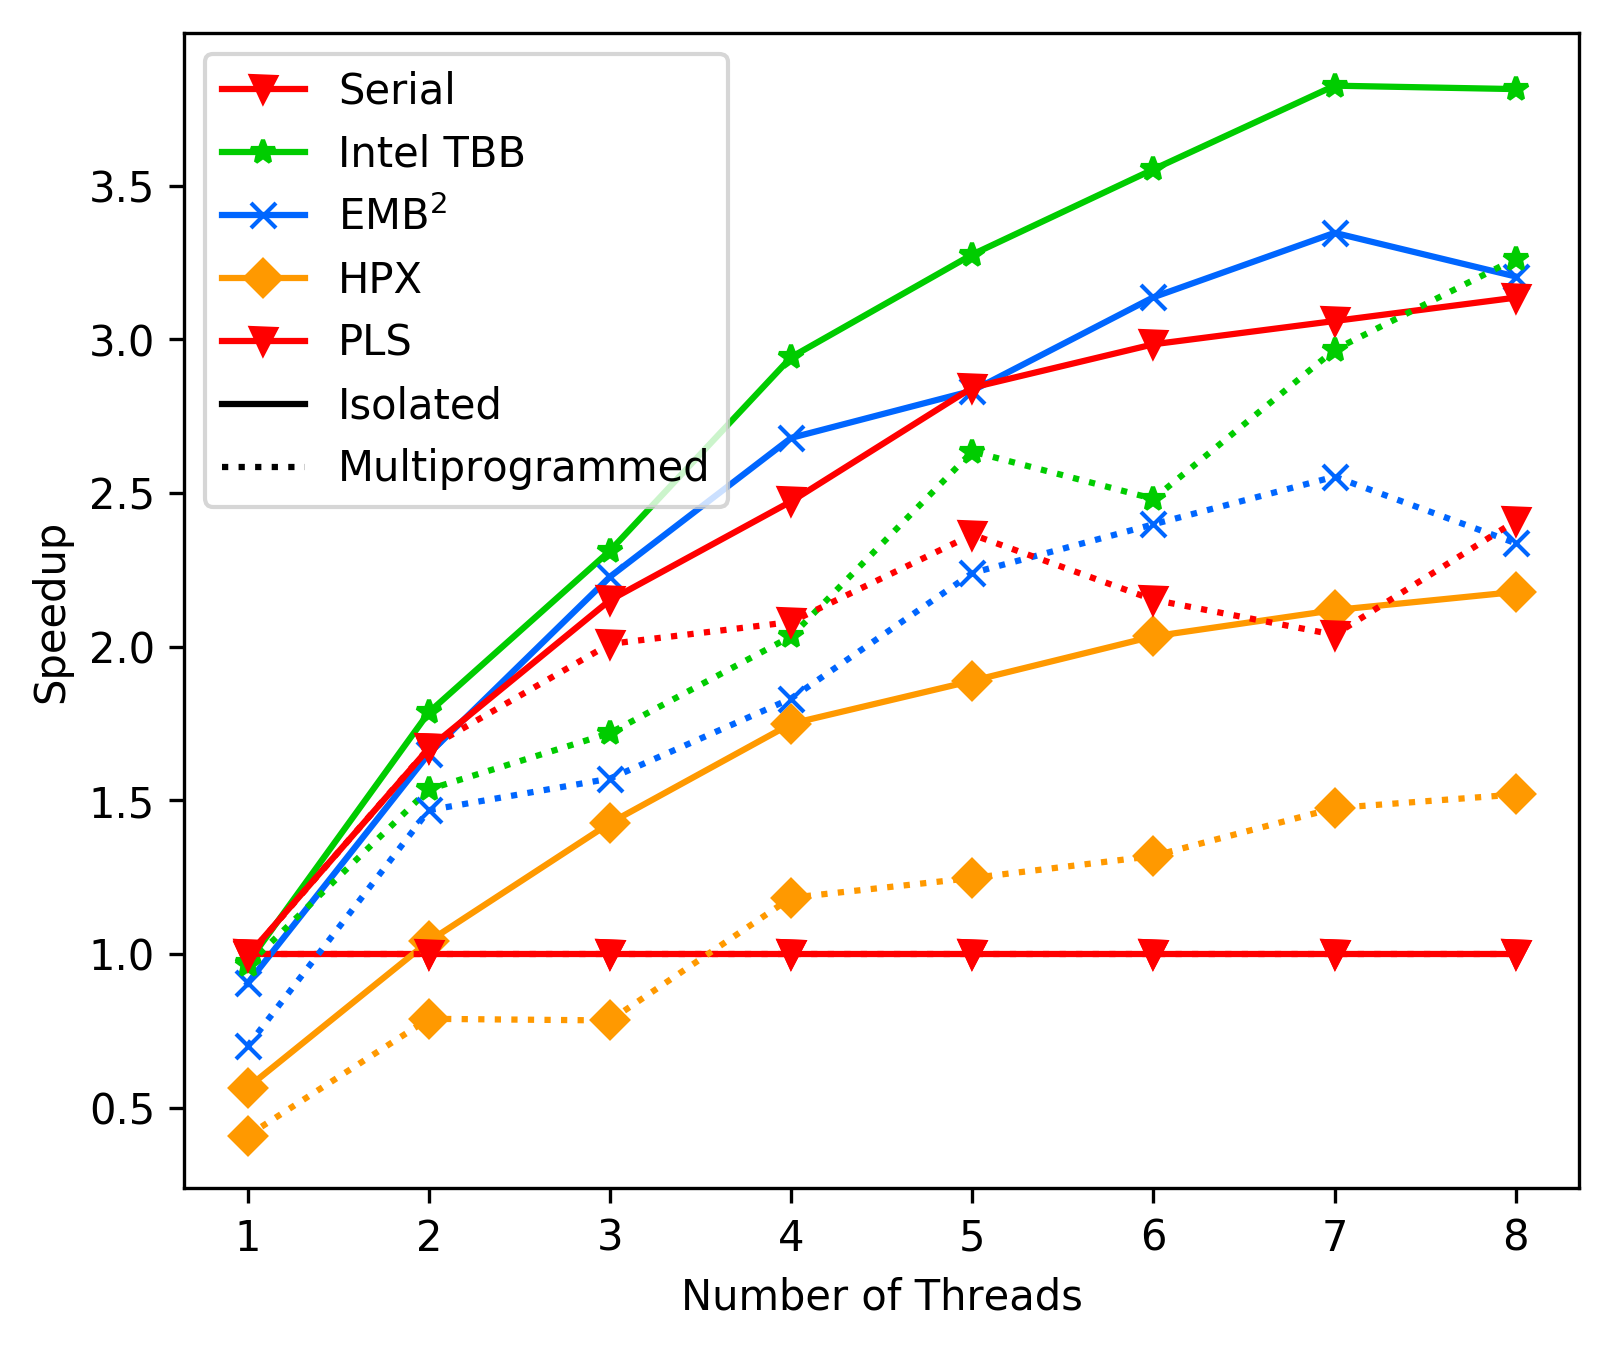
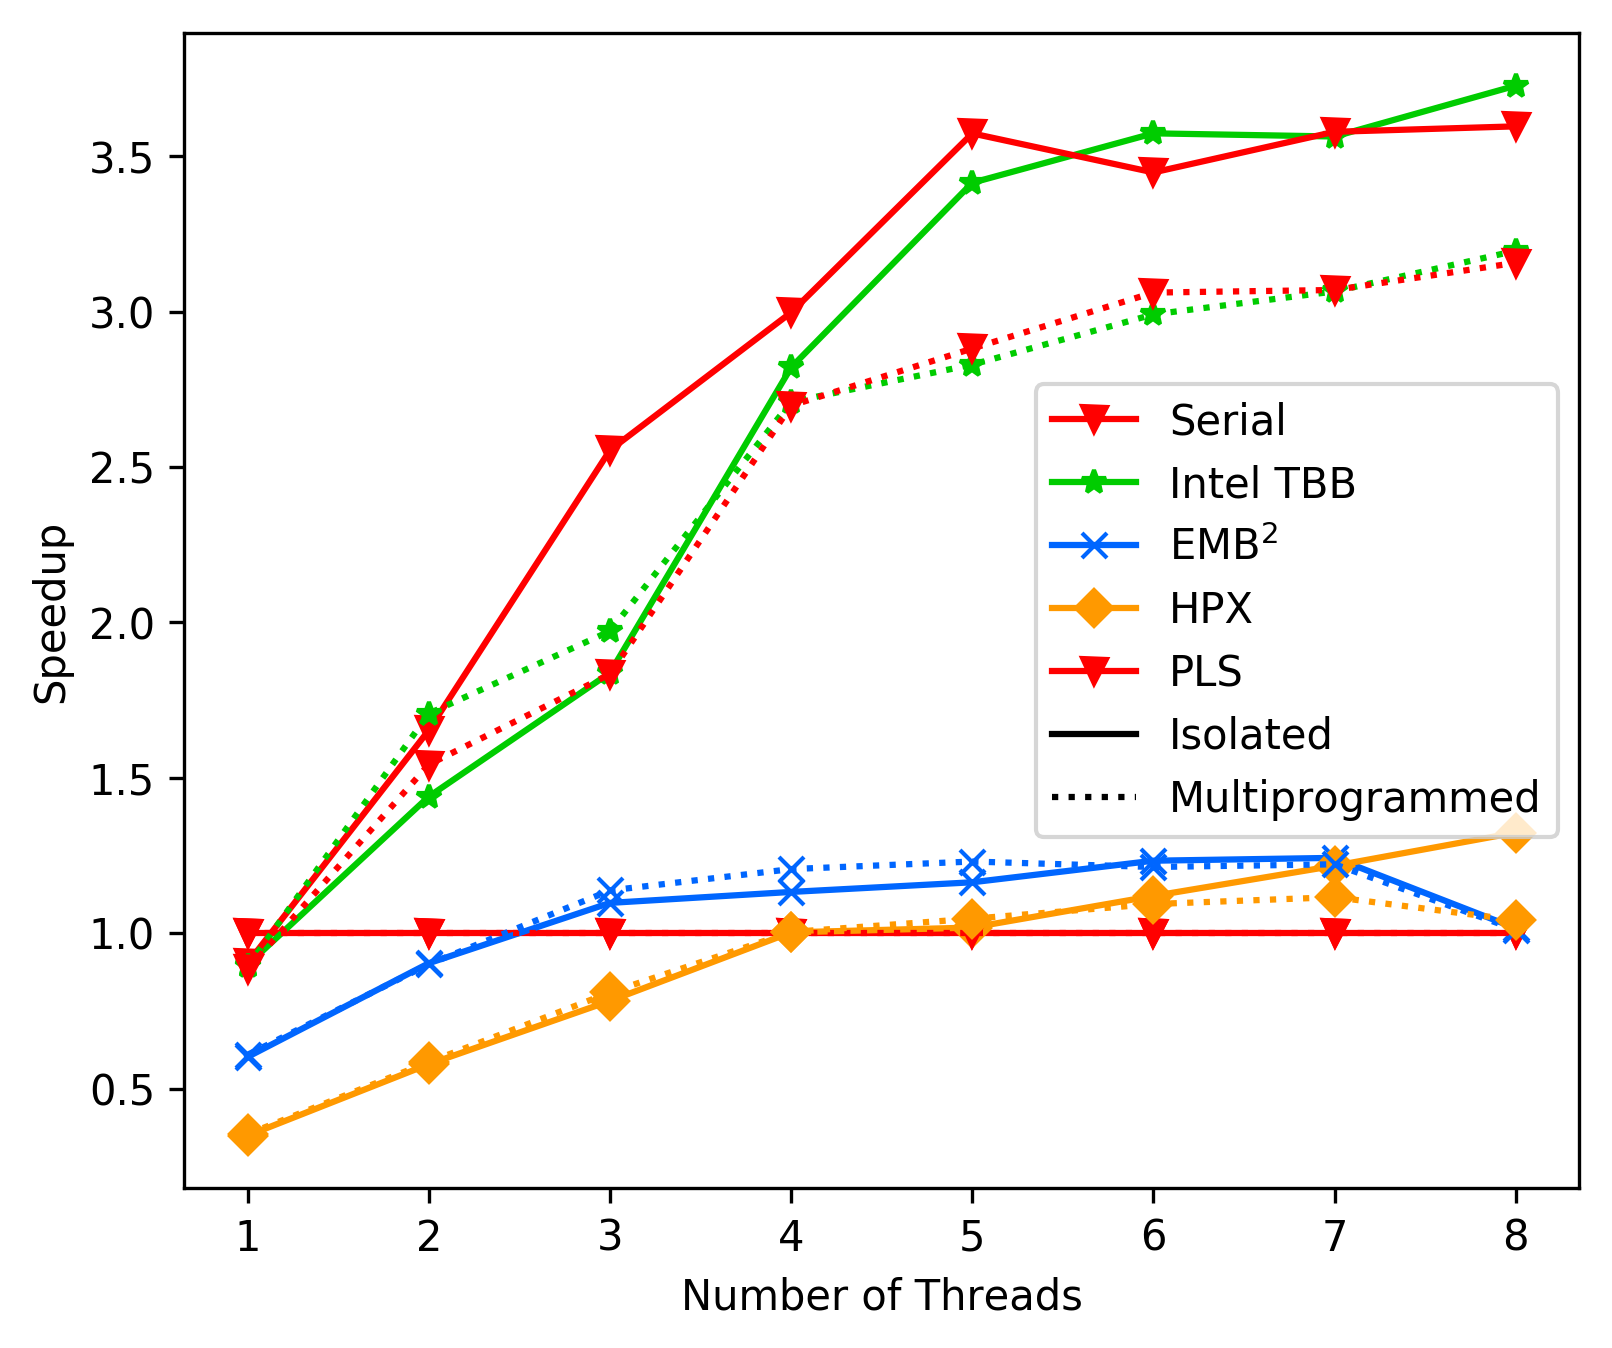
 As we can see, in average the performance of PLS starts getting
way worse than TBB and EMBB after 4 cores. We suspect this is due
to contemption, but could not resolve it with any combination
of `tas_spinlock` vs `ttas_spinlock` and `lock` vs `try_lock`.
This issue clearly needs further investigation.
### Commit aa27064 - Performance with ttsa spinlocks (and 'full blocking' top level)
As we can see, in average the performance of PLS starts getting
way worse than TBB and EMBB after 4 cores. We suspect this is due
to contemption, but could not resolve it with any combination
of `tas_spinlock` vs `ttas_spinlock` and `lock` vs `try_lock`.
This issue clearly needs further investigation.
### Commit aa27064 - Performance with ttsa spinlocks (and 'full blocking' top level)
 ### Commit d16ad3e - Performance with rw-lock and backoff
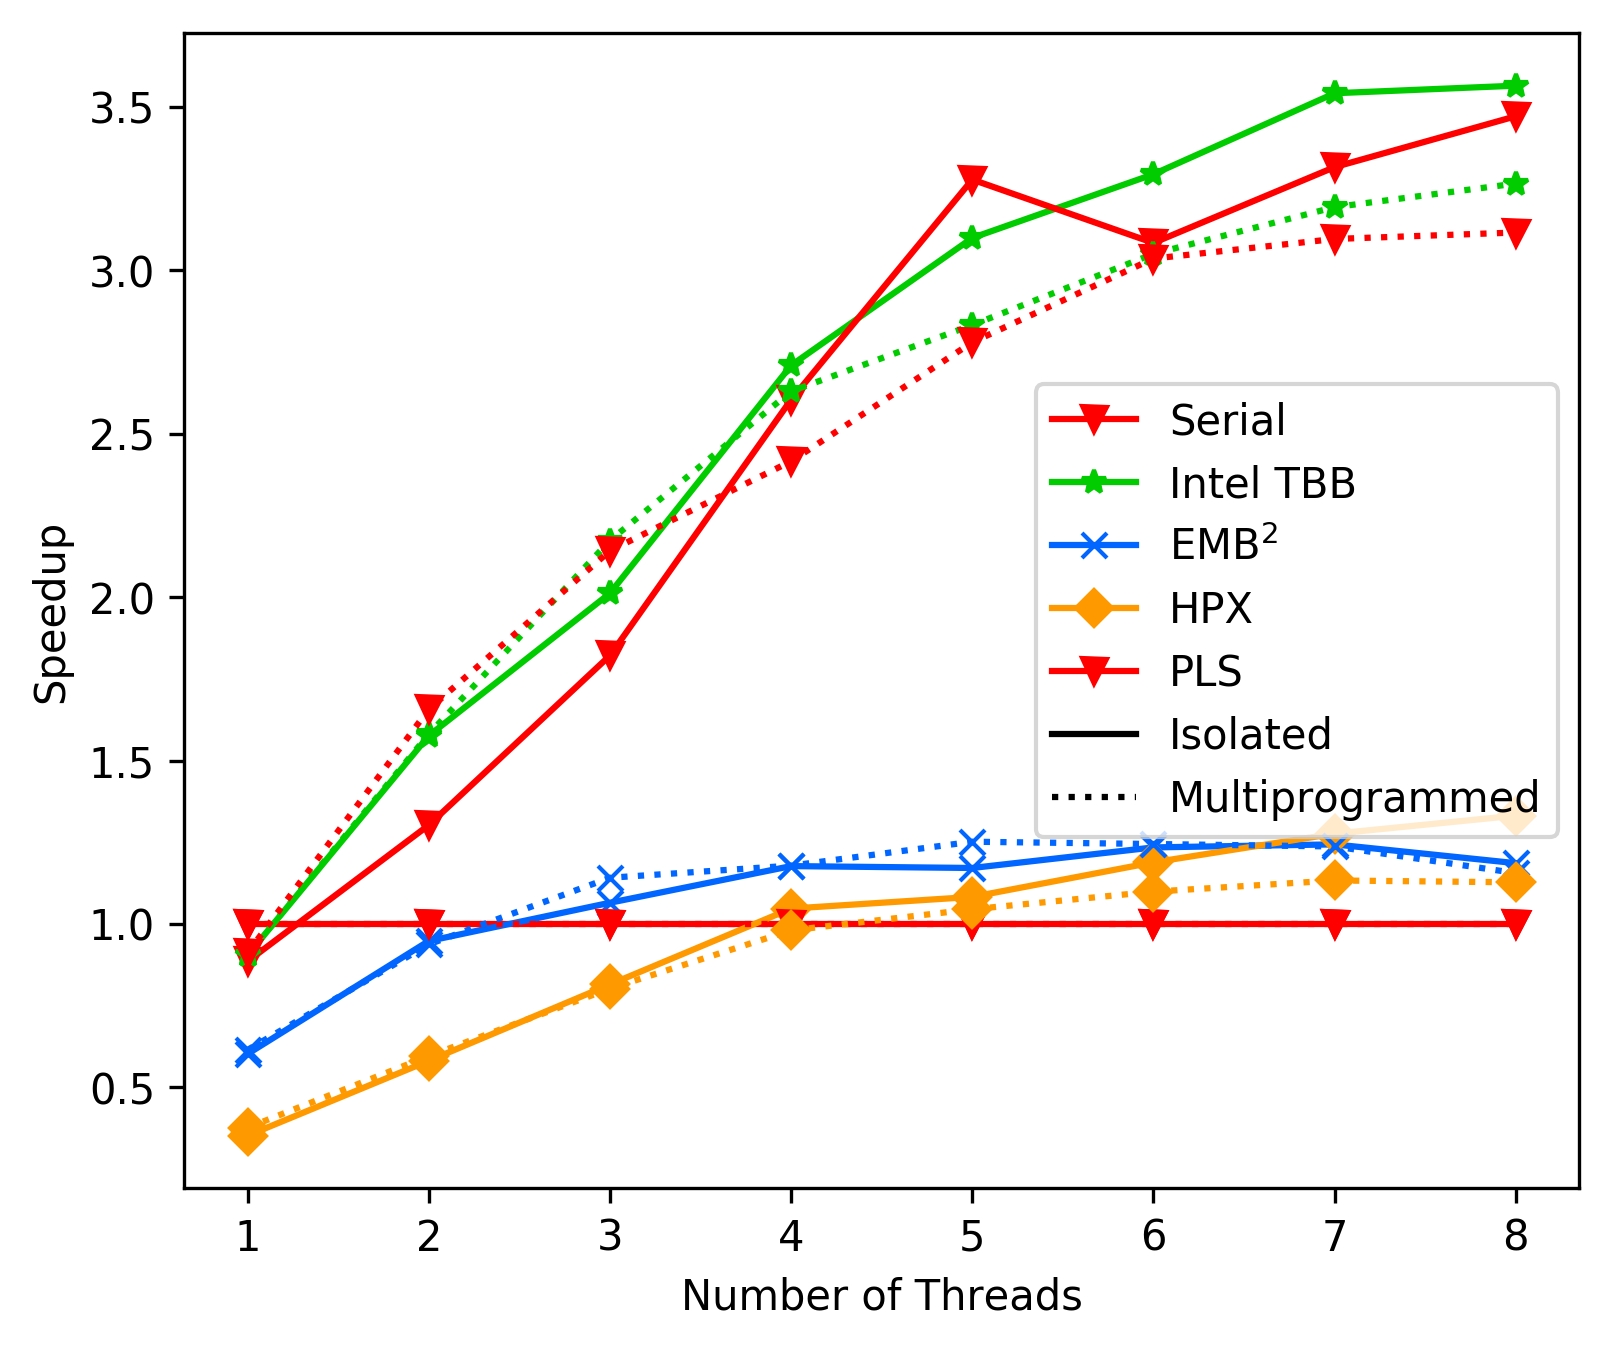
 ### Commit 18b2d744 - Performance with lock-free deque
After much tinkering we still have performance problems with higher
thread counts in the FFT benchmark. Upward from 4/5 threads the
performance gains start to saturate (before removing the top level
locks we even saw a slight drop in performance).
Currently the FFT benchmark shows the following results (average):
### Commit 18b2d744 - Performance with lock-free deque
After much tinkering we still have performance problems with higher
thread counts in the FFT benchmark. Upward from 4/5 threads the
performance gains start to saturate (before removing the top level
locks we even saw a slight drop in performance).
Currently the FFT benchmark shows the following results (average):
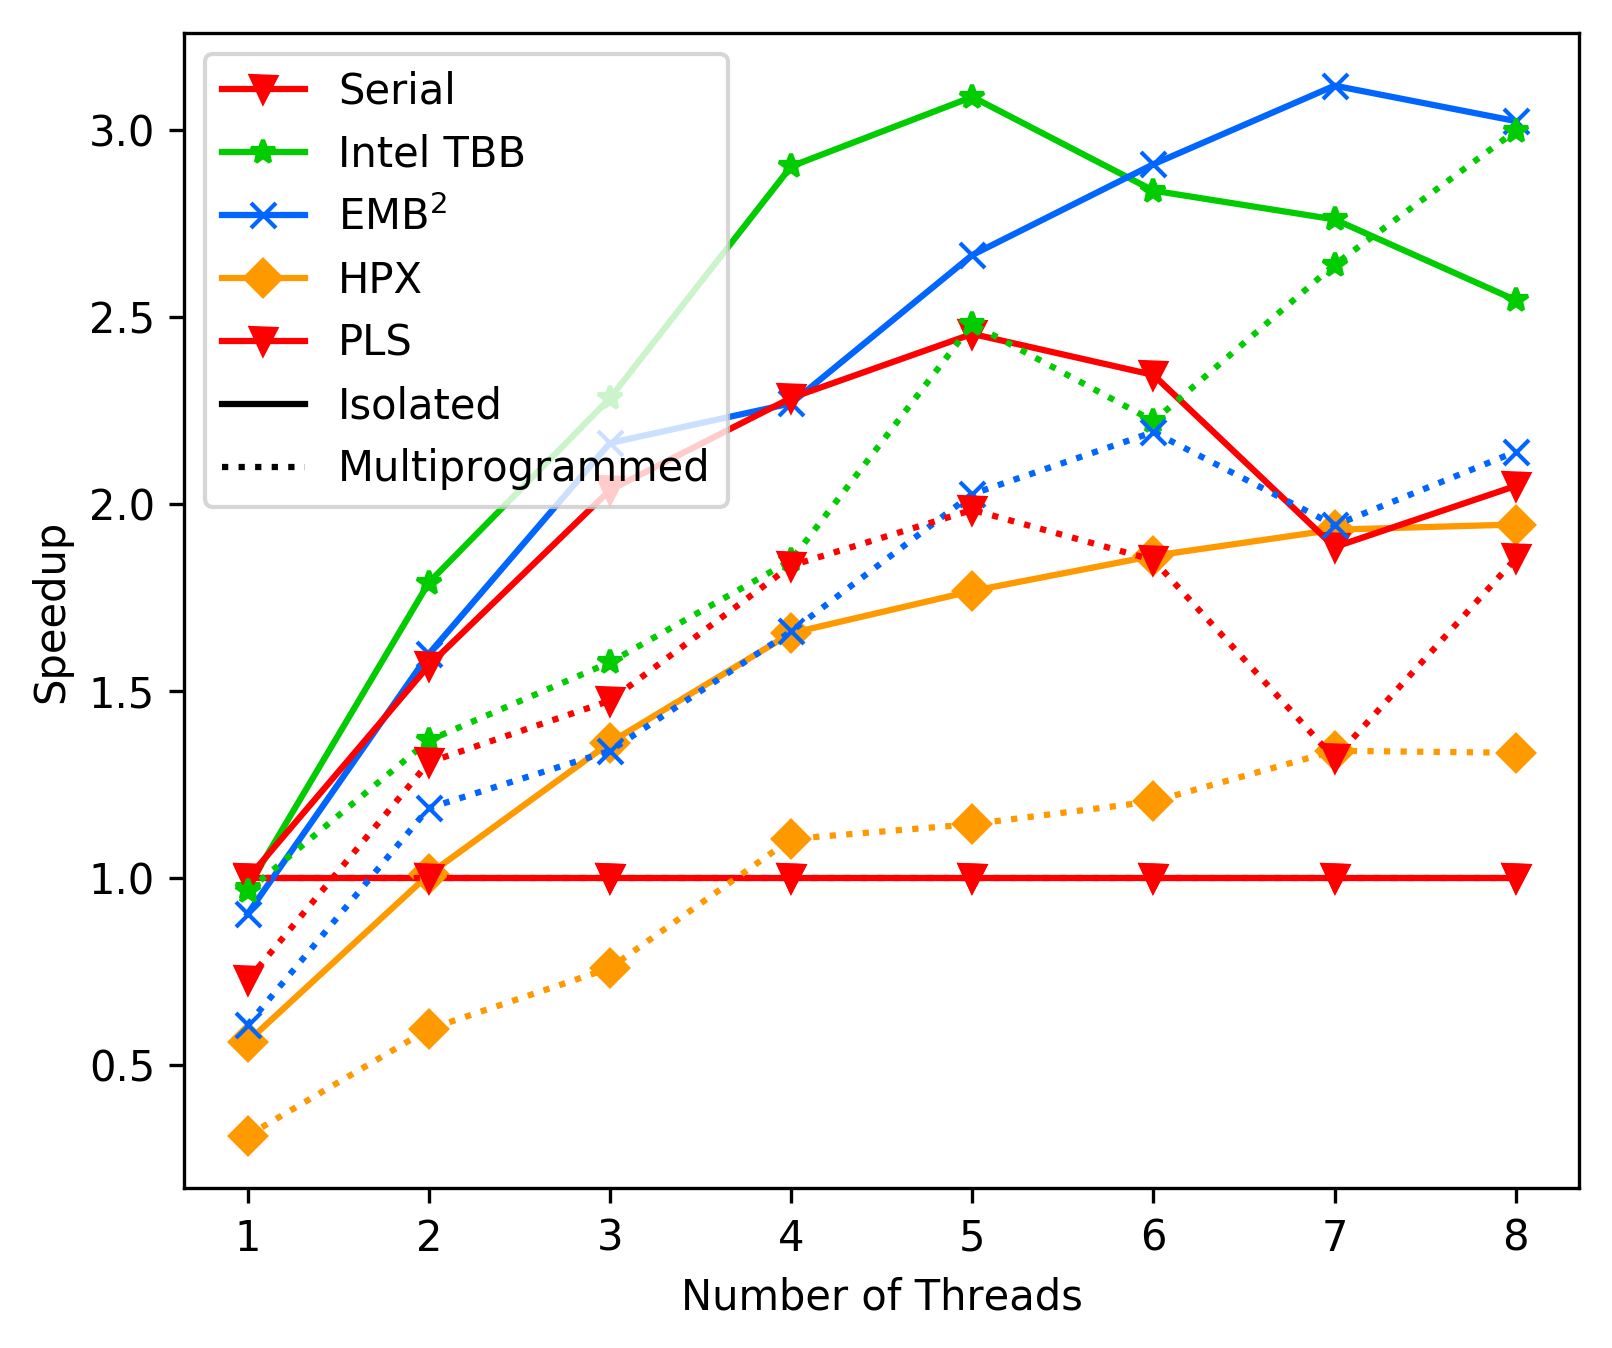
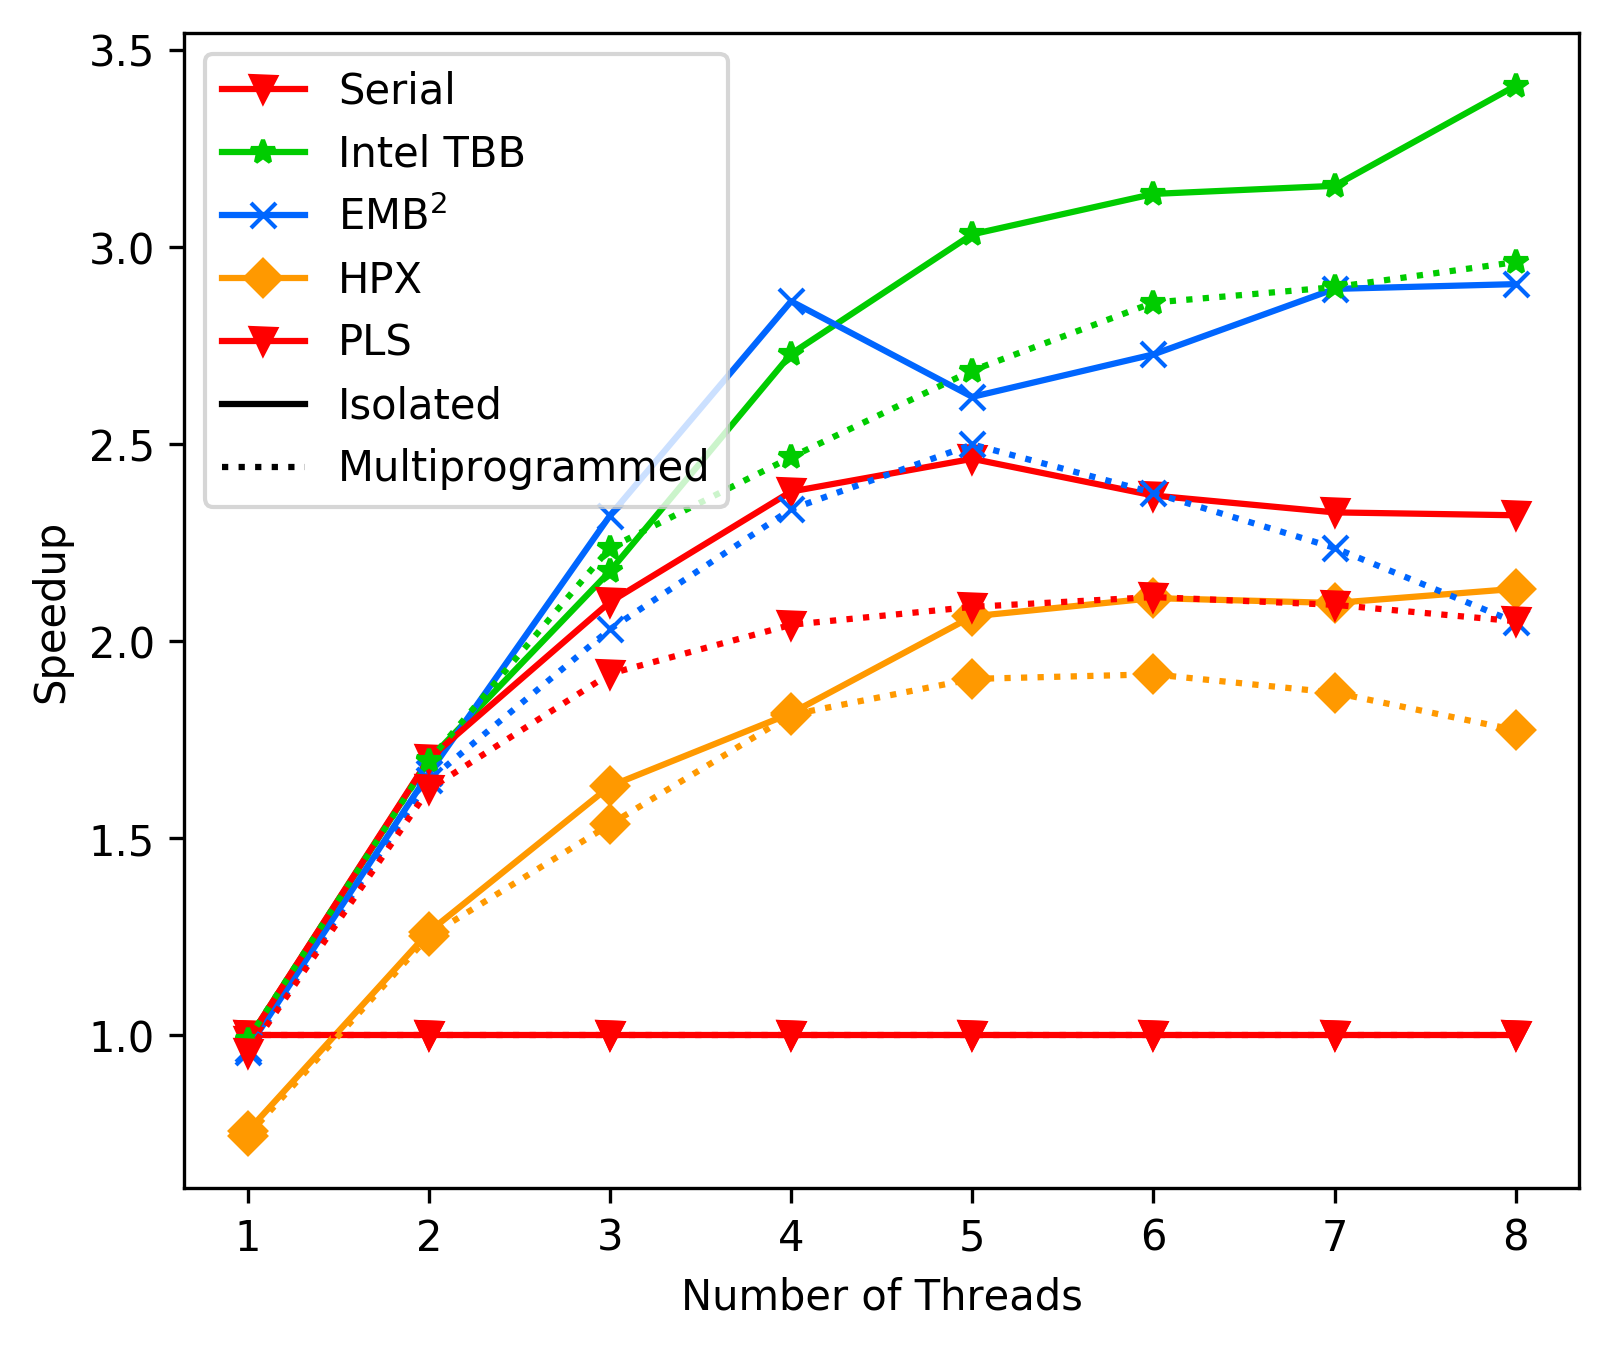
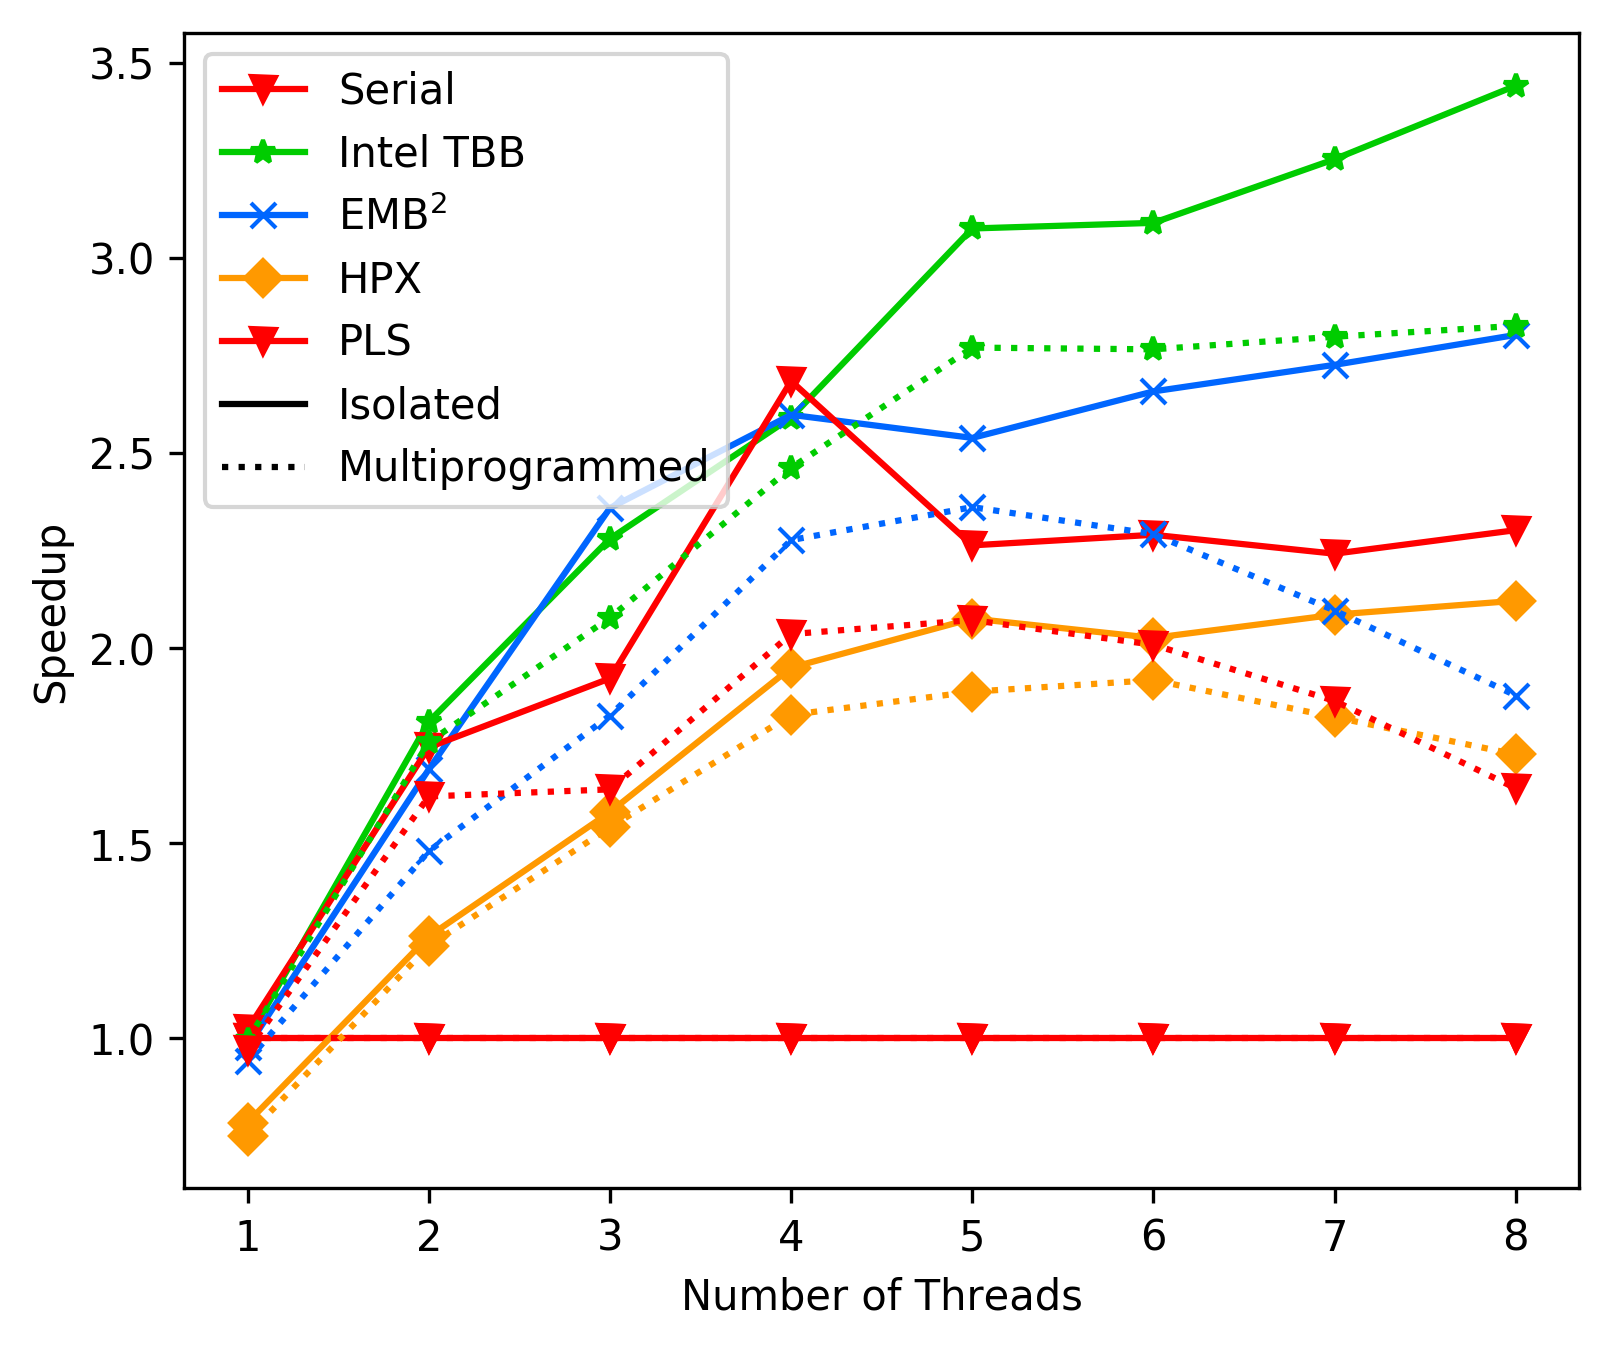
 We want to positively note that the overall trend of 'performance drops'
at the hyperthreading mark is not really bad anymore, it rather
seems similar to EMBB now (with backoff + lockfree deque + top level
reader-writers lock). This comes partly because the spike at 4 threads
is lower (less performance at 4 threads). We also see better times
on the multiprogramed system with the lock-free deque.
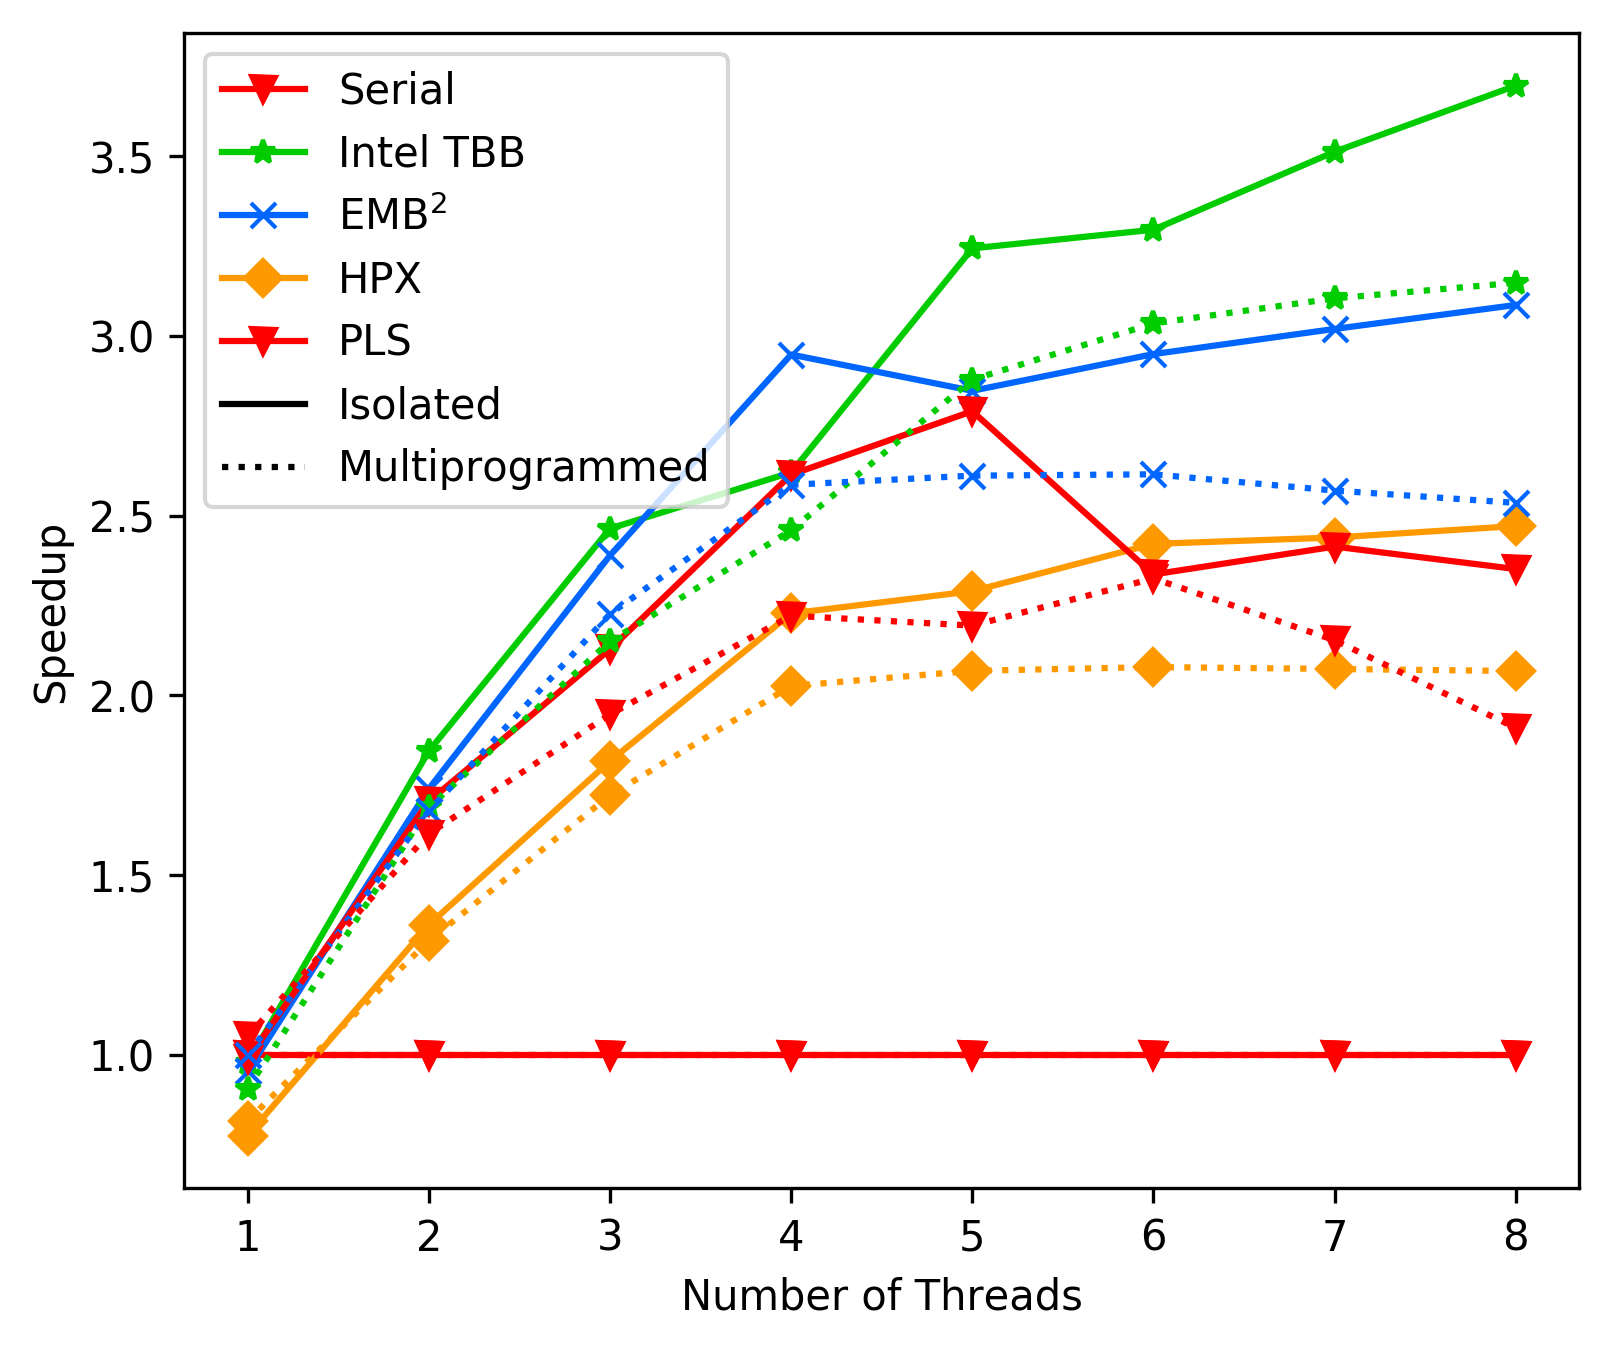
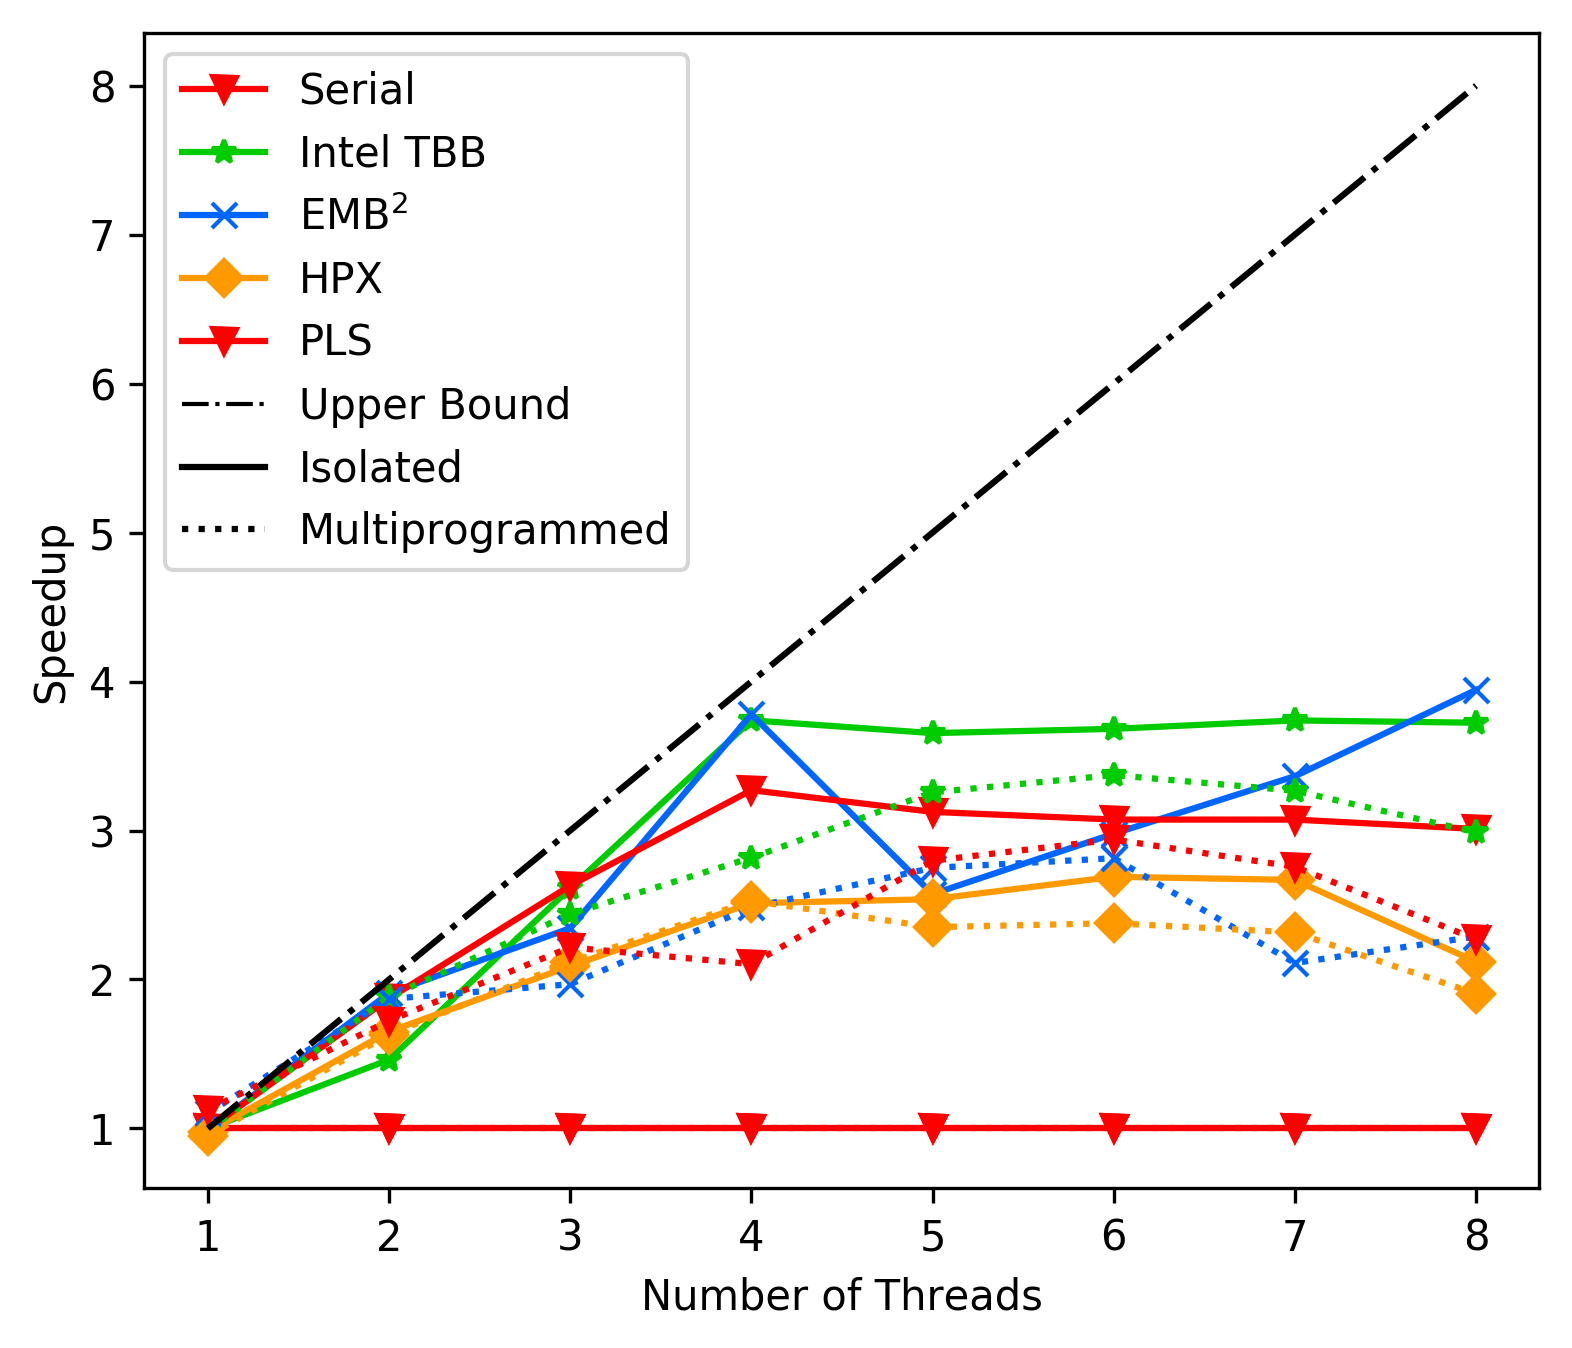
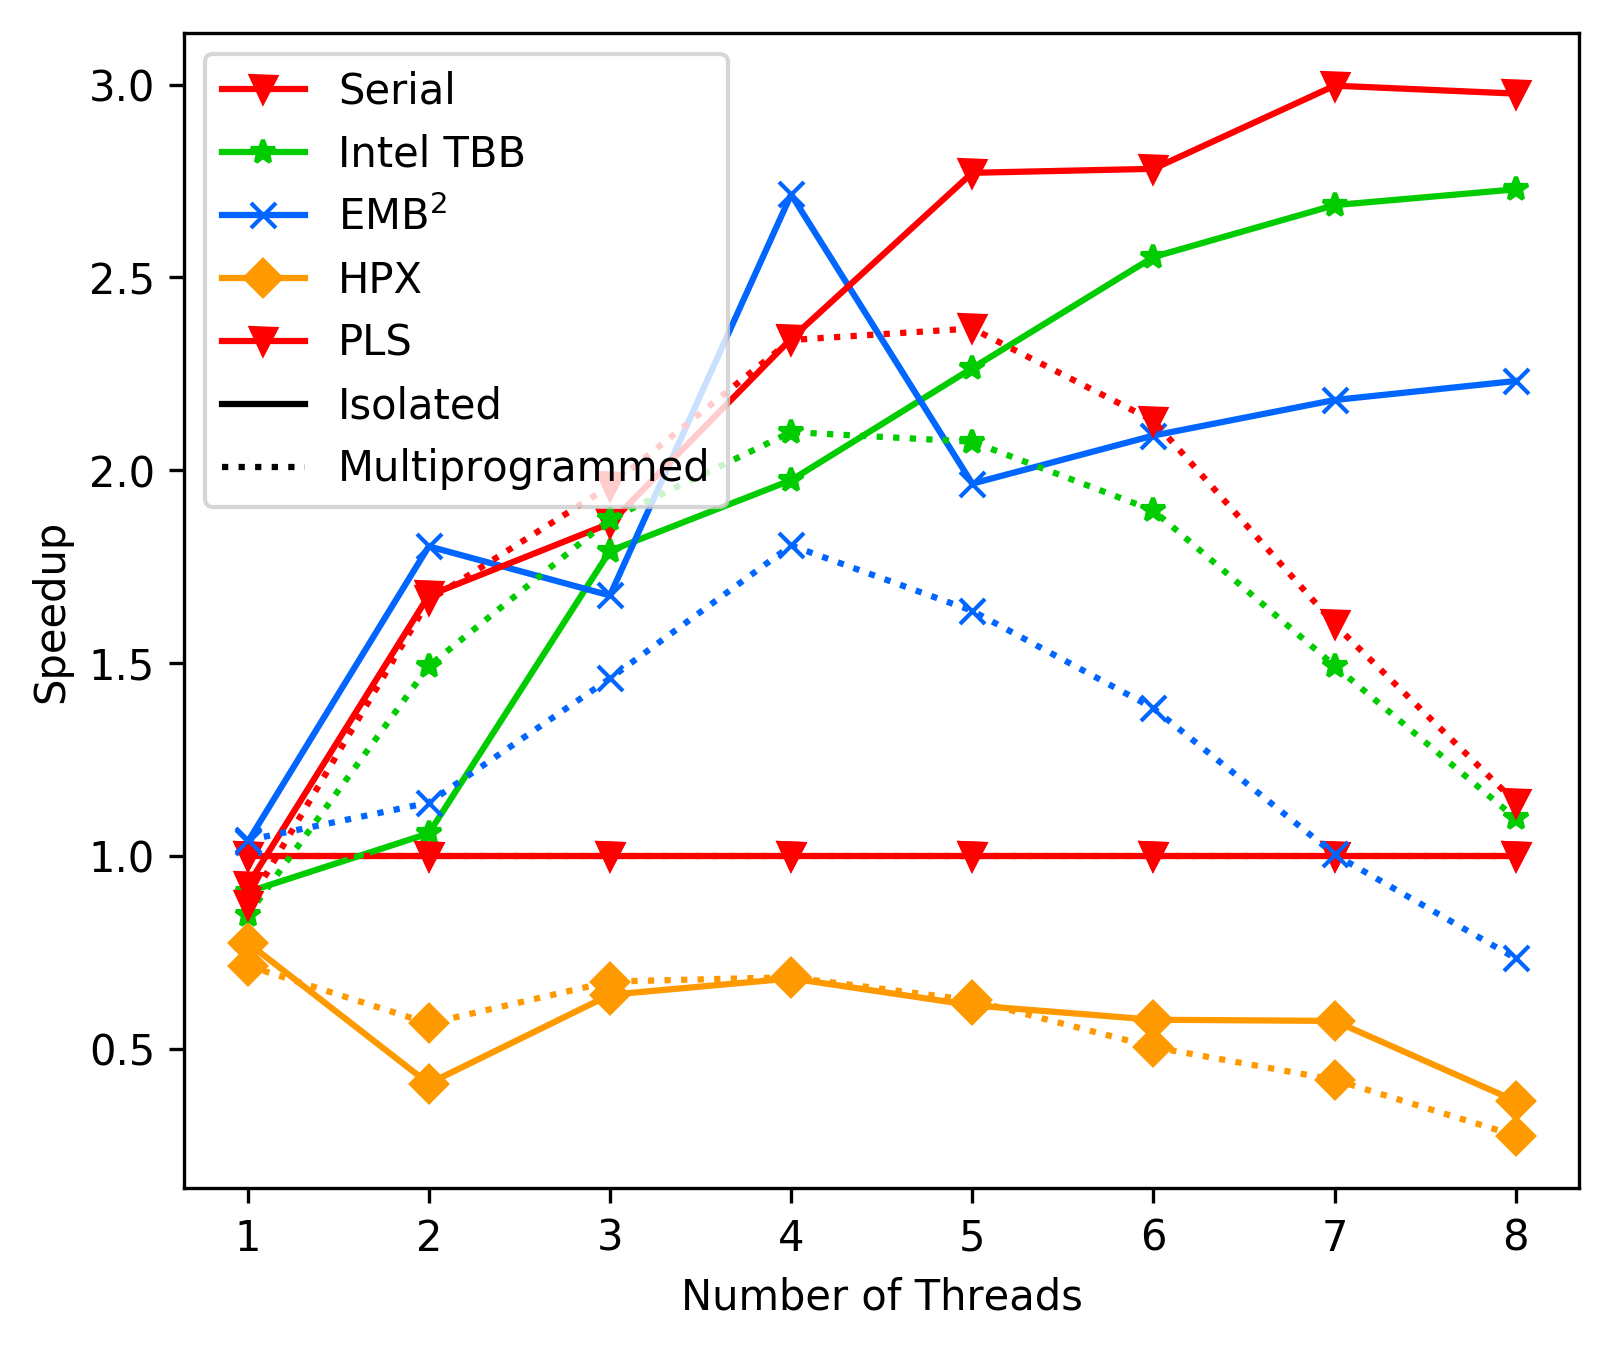
This is discouraging after many tests. To see where the overhead lies
we also implemented the unbalanced tree search benchmark,
resulting in the following, suprisingly good, results (average):
We want to positively note that the overall trend of 'performance drops'
at the hyperthreading mark is not really bad anymore, it rather
seems similar to EMBB now (with backoff + lockfree deque + top level
reader-writers lock). This comes partly because the spike at 4 threads
is lower (less performance at 4 threads). We also see better times
on the multiprogramed system with the lock-free deque.
This is discouraging after many tests. To see where the overhead lies
we also implemented the unbalanced tree search benchmark,
resulting in the following, suprisingly good, results (average):
 The main difference between the two benchmarks is, that the second
one has more work and the work is relatively independent.
Additionaly, the first one uses our high level API (parallel invoke),
while the second one uses our low level API.
It is worth investigating if either or high level API or the structure
of the memory access in FFT are the problem.
### Commit cf056856 - Remove two-level scheduler
In this test we replace the two level scheduler with ONLY fork_join
tasks. This removes the top level steal overhead and performs only
internal stealing. For this we set the fork_join task as the only
possible task type and removed the top level rw-lock, the digging
down to our level and solely use internal stealing.
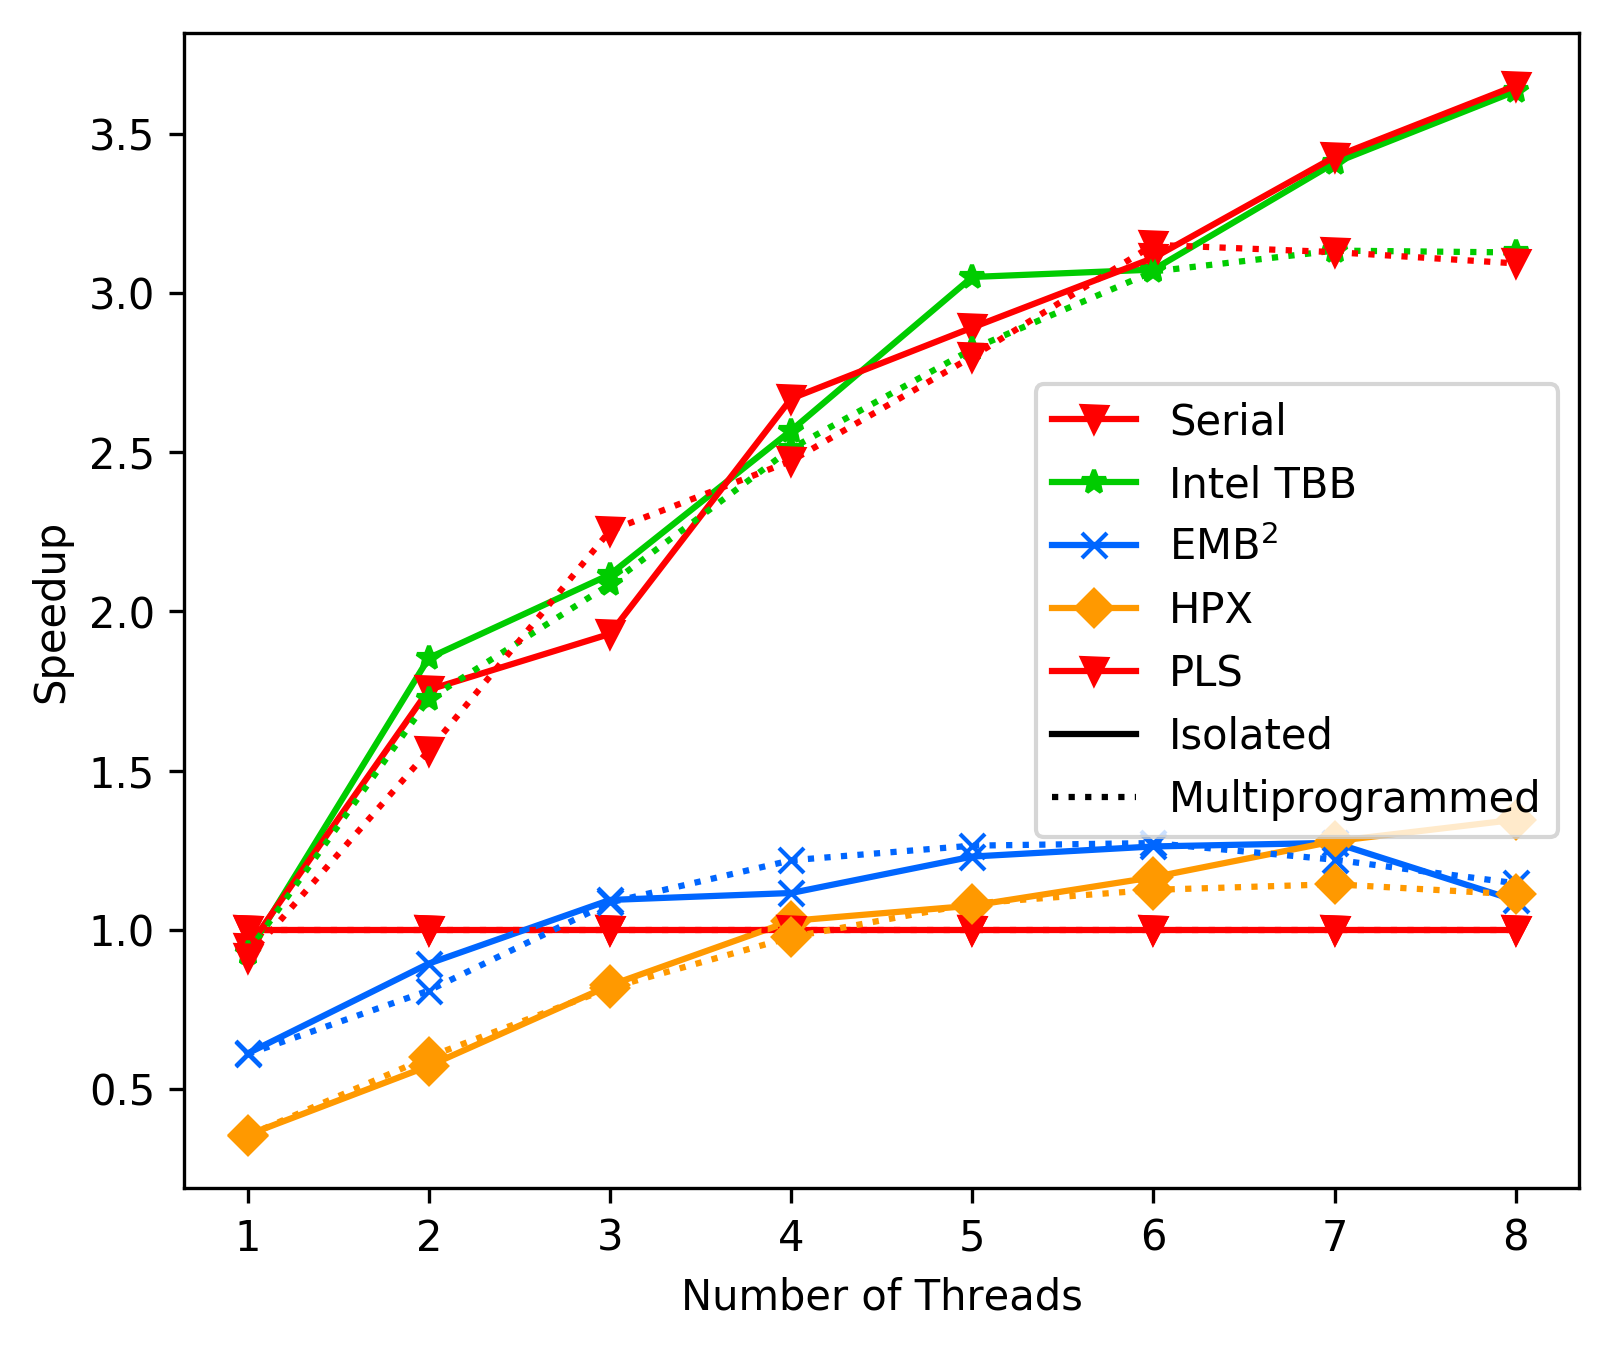
Average results FFT:
The main difference between the two benchmarks is, that the second
one has more work and the work is relatively independent.
Additionaly, the first one uses our high level API (parallel invoke),
while the second one uses our low level API.
It is worth investigating if either or high level API or the structure
of the memory access in FFT are the problem.
### Commit cf056856 - Remove two-level scheduler
In this test we replace the two level scheduler with ONLY fork_join
tasks. This removes the top level steal overhead and performs only
internal stealing. For this we set the fork_join task as the only
possible task type and removed the top level rw-lock, the digging
down to our level and solely use internal stealing.
Average results FFT:
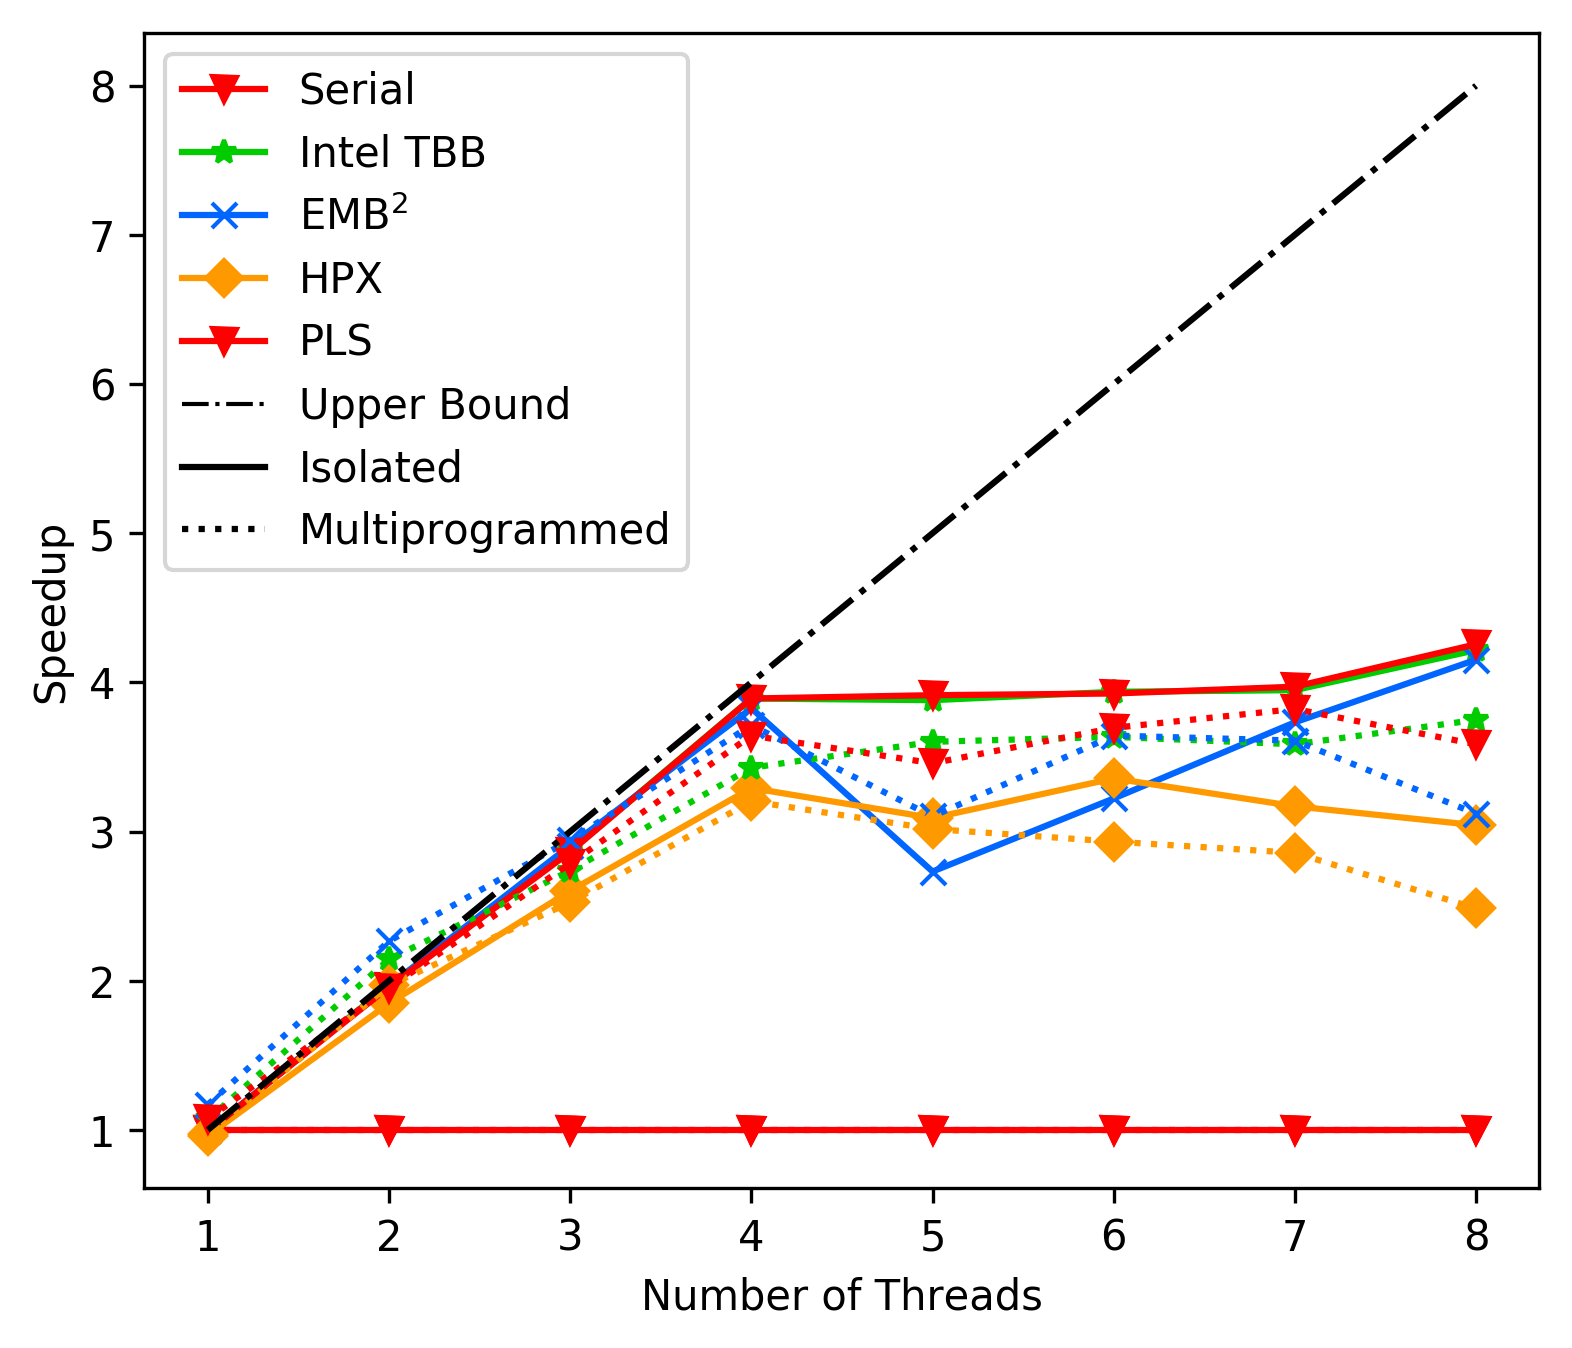
 Average results Unbalanced:
 There seems to be only a minor performance difference between the two,
suggesting tha our two-level approach is not the part causing our
weaker performance.
### Commit afd0331b - Some notes on scaling problems
After tweaking individual values and parameters we can still not find
the main cause for our slowdown on multiple processors.
We also use intel's vtune amplifier to measure performance on our run
and find that we always spend way too much time 'waiting for work',
e.g. in the backoff mechanism when enabled or in the locks for stealing
work when backoff is disabled. This leads us to believe that our problems
might be connected to some issue with work distribution on the FFT case,
as the unbalanced tree search (with a lot 'local' work) performs good.
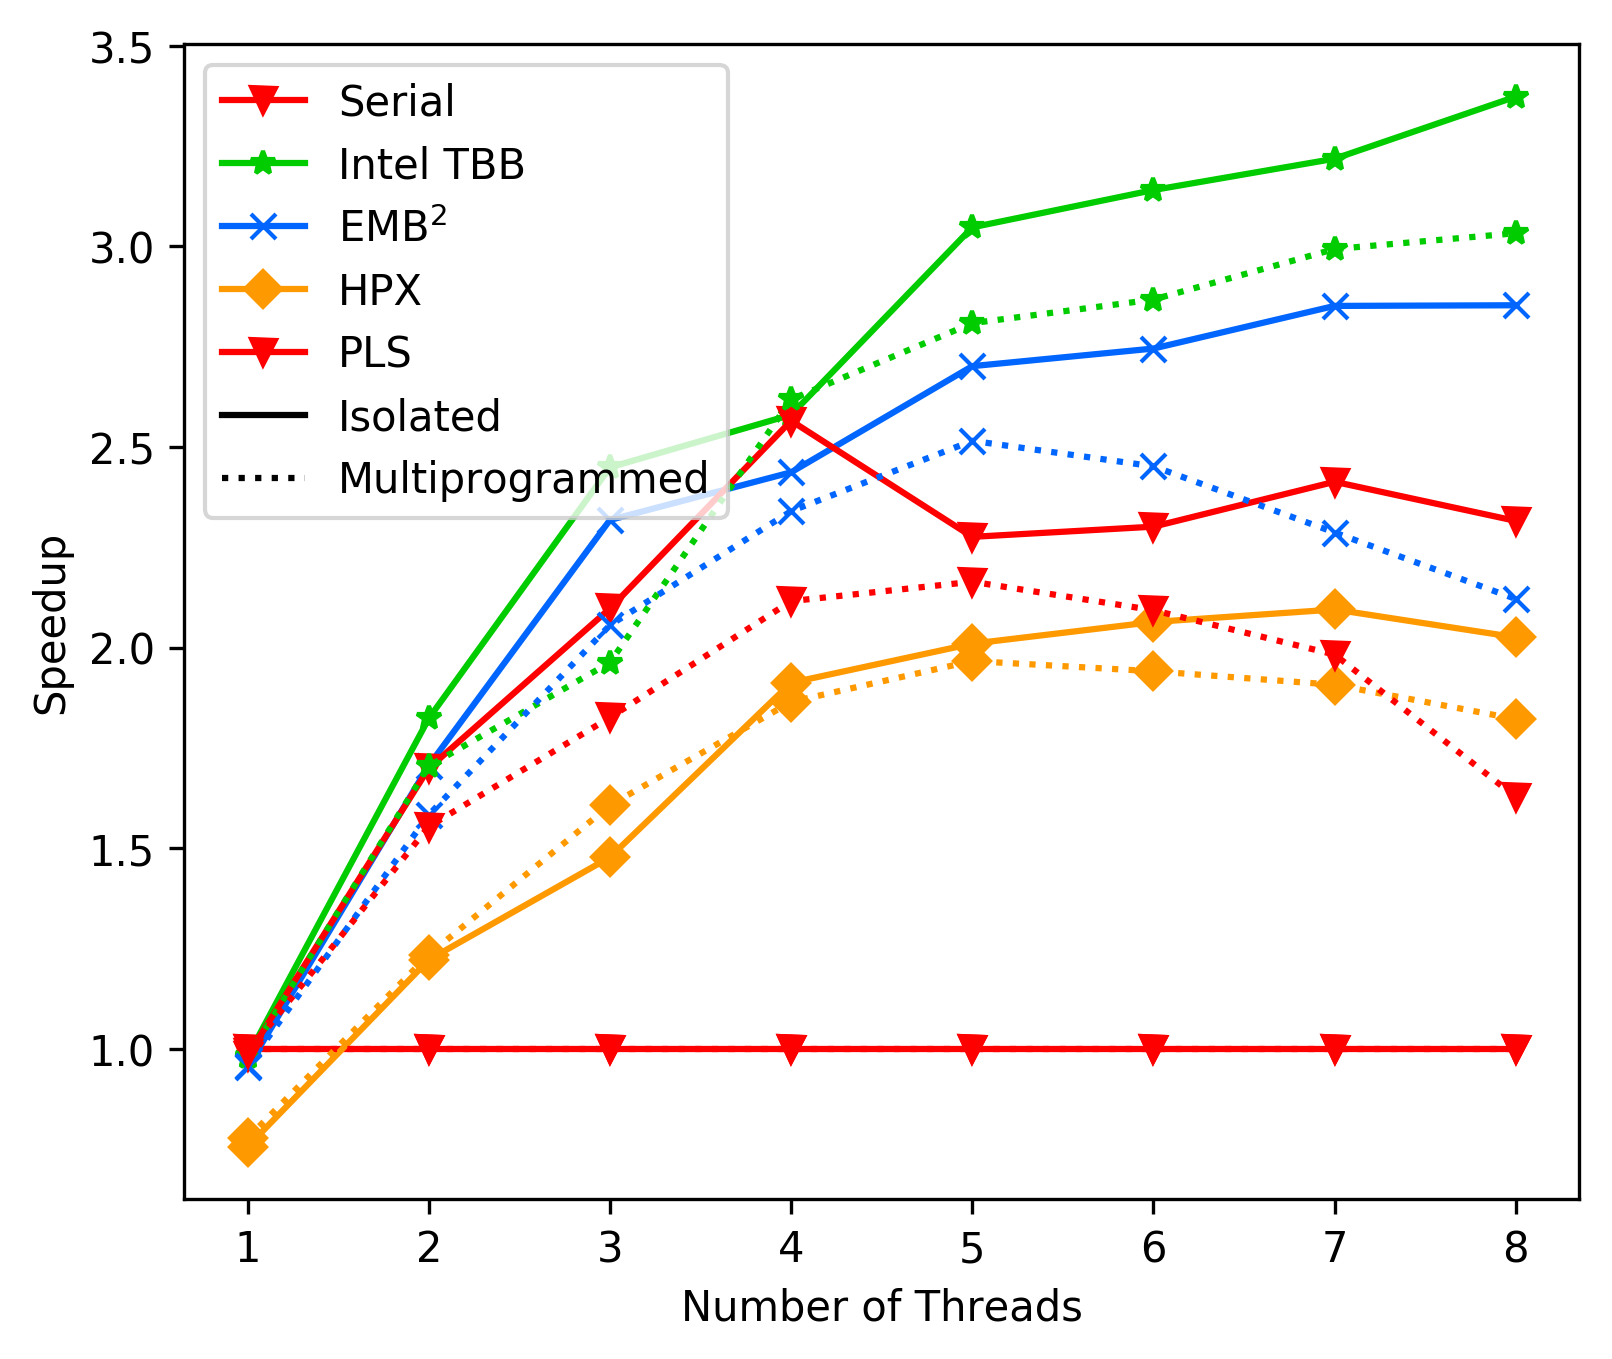
To get more data in we add benchmarks on matrix multiplication implemented
in two fashions: once with a 'native' array stealing task and once with
a fork-join task. Both implementations use the same minimum array
sub-size of 4 elements and we can hopefully see if they have any
performance differences.
Best case fork-join:
There seems to be only a minor performance difference between the two,
suggesting tha our two-level approach is not the part causing our
weaker performance.
### Commit afd0331b - Some notes on scaling problems
After tweaking individual values and parameters we can still not find
the main cause for our slowdown on multiple processors.
We also use intel's vtune amplifier to measure performance on our run
and find that we always spend way too much time 'waiting for work',
e.g. in the backoff mechanism when enabled or in the locks for stealing
work when backoff is disabled. This leads us to believe that our problems
might be connected to some issue with work distribution on the FFT case,
as the unbalanced tree search (with a lot 'local' work) performs good.
To get more data in we add benchmarks on matrix multiplication implemented
in two fashions: once with a 'native' array stealing task and once with
a fork-join task. Both implementations use the same minimum array
sub-size of 4 elements and we can hopefully see if they have any
performance differences.
Best case fork-join:
 Average case fork-join:
 Best case Native:
 Average case Native:
 What we find very interesting is, that the best case times of our
pls library are very fast (as good as TBB), but the average times
drop badly. We currently do not know why this is the case.
### Commit afd0331b - Intel VTune Amplifier
We did serval measurements with intel's VTune Amplifier profiling
tool. The main thing that we notice is, that the cycles per instruction
for our useful work blocks increase, thus requiring more CPU time
for the acutal useful work.
We also measured an implementation using TBB and found no significante
difference, e.g. TBB also has a higher CPI with 8 threads.
Our conclusion after this long hunting for performance is, that we
might just be bound by some general performance issues with our code.
The next step will therefore be to read the other frameworks and our
code carefully, trying to find potential issues.
### Commit 116cf4af - Removing Exponential Backoff
In the steal loop we first hade a backoff-mechanism as often seen in
locks (spin with relaxed CPU, then sleep/yield after too many backoffs).
The rationale behind this is to relax the memory bus by not busily
working on atomic variables. We introduced it first with the fear that
keeping the CPU busy with spinning would degregade performance of the
other working threads. However, the above examination with Intel VTune
showed that this seems to not be the main problem of our implementation
(TBB shows the same CPI increases with more threads, our implementation
seems fine in this regard).
To further reduce elements that could cause performance problems, we
therefore decided to perform one more measurement without this backoff.
#### Results of FFT
The first measurement is on the FFT. Here we tested two variants:
One with a 'yield/sleep' statement after a worker thread failed
to steal any work after the first try on every other thread and
one without this sleep. The rationale behind the sleep is that
it relaxes the CPU (it is also found in EMBB).
Average with sleep:
What we find very interesting is, that the best case times of our
pls library are very fast (as good as TBB), but the average times
drop badly. We currently do not know why this is the case.
### Commit afd0331b - Intel VTune Amplifier
We did serval measurements with intel's VTune Amplifier profiling
tool. The main thing that we notice is, that the cycles per instruction
for our useful work blocks increase, thus requiring more CPU time
for the acutal useful work.
We also measured an implementation using TBB and found no significante
difference, e.g. TBB also has a higher CPI with 8 threads.
Our conclusion after this long hunting for performance is, that we
might just be bound by some general performance issues with our code.
The next step will therefore be to read the other frameworks and our
code carefully, trying to find potential issues.
### Commit 116cf4af - Removing Exponential Backoff
In the steal loop we first hade a backoff-mechanism as often seen in
locks (spin with relaxed CPU, then sleep/yield after too many backoffs).
The rationale behind this is to relax the memory bus by not busily
working on atomic variables. We introduced it first with the fear that
keeping the CPU busy with spinning would degregade performance of the
other working threads. However, the above examination with Intel VTune
showed that this seems to not be the main problem of our implementation
(TBB shows the same CPI increases with more threads, our implementation
seems fine in this regard).
To further reduce elements that could cause performance problems, we
therefore decided to perform one more measurement without this backoff.
#### Results of FFT
The first measurement is on the FFT. Here we tested two variants:
One with a 'yield/sleep' statement after a worker thread failed
to steal any work after the first try on every other thread and
one without this sleep. The rationale behind the sleep is that
it relaxes the CPU (it is also found in EMBB).
Average with sleep:
 Average without sleep:
 We clearly observe that the version without a sleep statement
is faster, and thus in future experiments/measurements
will exclude this statement. This also makes sense, as our
steal loop can fail, even thought there potentially is work
(because of our lock free deque implementation).
#### Results Matrix
We re-ran our benchmarks on the fork-join and native matrix
multiplication implementation to see how those change without
the backoff. We expect good results, as the matrix multiplication
mostly has enough work to keep all threads busy, thus having
workers less time spinning in the steal loop.
Average Fork-Join Matrix:
We clearly observe that the version without a sleep statement
is faster, and thus in future experiments/measurements
will exclude this statement. This also makes sense, as our
steal loop can fail, even thought there potentially is work
(because of our lock free deque implementation).
#### Results Matrix
We re-ran our benchmarks on the fork-join and native matrix
multiplication implementation to see how those change without
the backoff. We expect good results, as the matrix multiplication
mostly has enough work to keep all threads busy, thus having
workers less time spinning in the steal loop.
Average Fork-Join Matrix:
 Average Native Matrix:
 The results are far better than the last ones, and indicate that
removing the backoff can drasticly improve performance.
#### Conclusion
We will exclude the backoff mechanisms for further tests, as this
seems to generally improve (or at least not harm performance in
case of FFT).
We also want to note that all these measurements are not very
controlled/scientific, but simply ran ot our notebook for
fast iterations over different, potential issues with our scheduler.
### Commit 116cf4af - VTune Amplifier and MRSW top level lock
When looking at why our code works quite well on problems with
mostly busy workers and not so well on code with spinning/waiting
workers (like in the FFT), we take a closer look at the FFT and
matrix multiplication in VTune.
FFT:
The results are far better than the last ones, and indicate that
removing the backoff can drasticly improve performance.
#### Conclusion
We will exclude the backoff mechanisms for further tests, as this
seems to generally improve (or at least not harm performance in
case of FFT).
We also want to note that all these measurements are not very
controlled/scientific, but simply ran ot our notebook for
fast iterations over different, potential issues with our scheduler.
### Commit 116cf4af - VTune Amplifier and MRSW top level lock
When looking at why our code works quite well on problems with
mostly busy workers and not so well on code with spinning/waiting
workers (like in the FFT), we take a closer look at the FFT and
matrix multiplication in VTune.
FFT:
 Matrix:
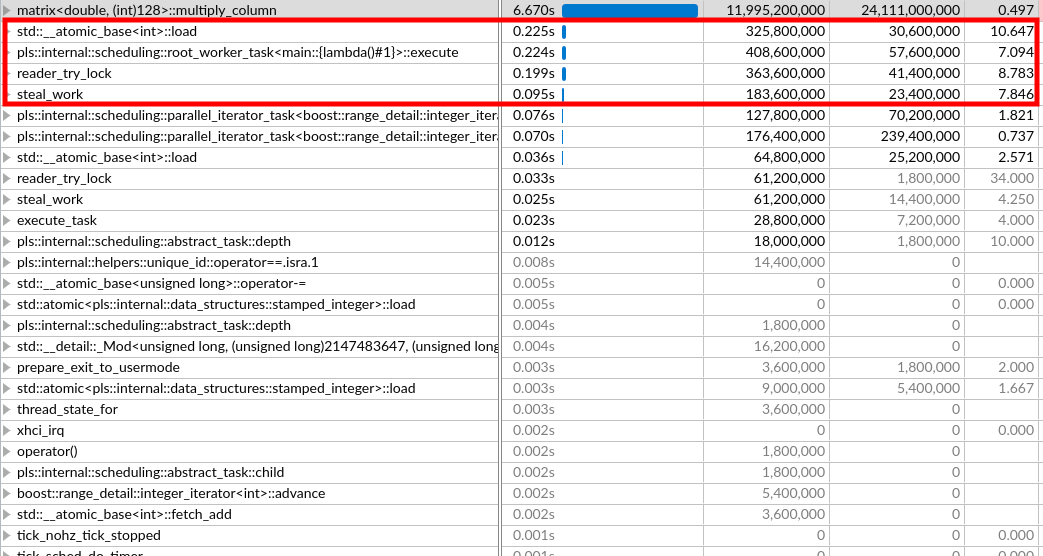 The sections highlighted in red represent parts of the code spent
on spinning in the work-stealing loop.
We can see that as long as our workers are mainly busy/find work
in the stealing loop the overhead spent on spinning is minimal.
We can also see that in the FFT considerable amounts of time are
spent spining.
A general observation are the high CPI rates for our spinning code.
This makes sense, as we are currently working on locks that share
atomic variables in order to work, thus leading to cache misses.
### Commit 116cf4af - 2D Heat Diffusion
As a last test for our current state on performance we implemented the
2D heat diffusion benchmark using our framework (using fork-join based
parallel_for, 512 heat array size):
The sections highlighted in red represent parts of the code spent
on spinning in the work-stealing loop.
We can see that as long as our workers are mainly busy/find work
in the stealing loop the overhead spent on spinning is minimal.
We can also see that in the FFT considerable amounts of time are
spent spining.
A general observation are the high CPI rates for our spinning code.
This makes sense, as we are currently working on locks that share
atomic variables in order to work, thus leading to cache misses.
### Commit 116cf4af - 2D Heat Diffusion
As a last test for our current state on performance we implemented the
2D heat diffusion benchmark using our framework (using fork-join based
parallel_for, 512 heat array size):
 We observe solid performance from our implementation.
(Again, not very scientific test environment, but good enough for
our general direction)
### Commit 3bdaba42 - Move to pure fork-join tasks (remove two level)
We moved away from our two-level scheduler approach towards a
pure fork-join task model (in order to remove any lock's in the
code more easily and to make further tests simpler/more focused
on one specific aspecs.
These are the measurements made after the change
(without any performance optimizations done):
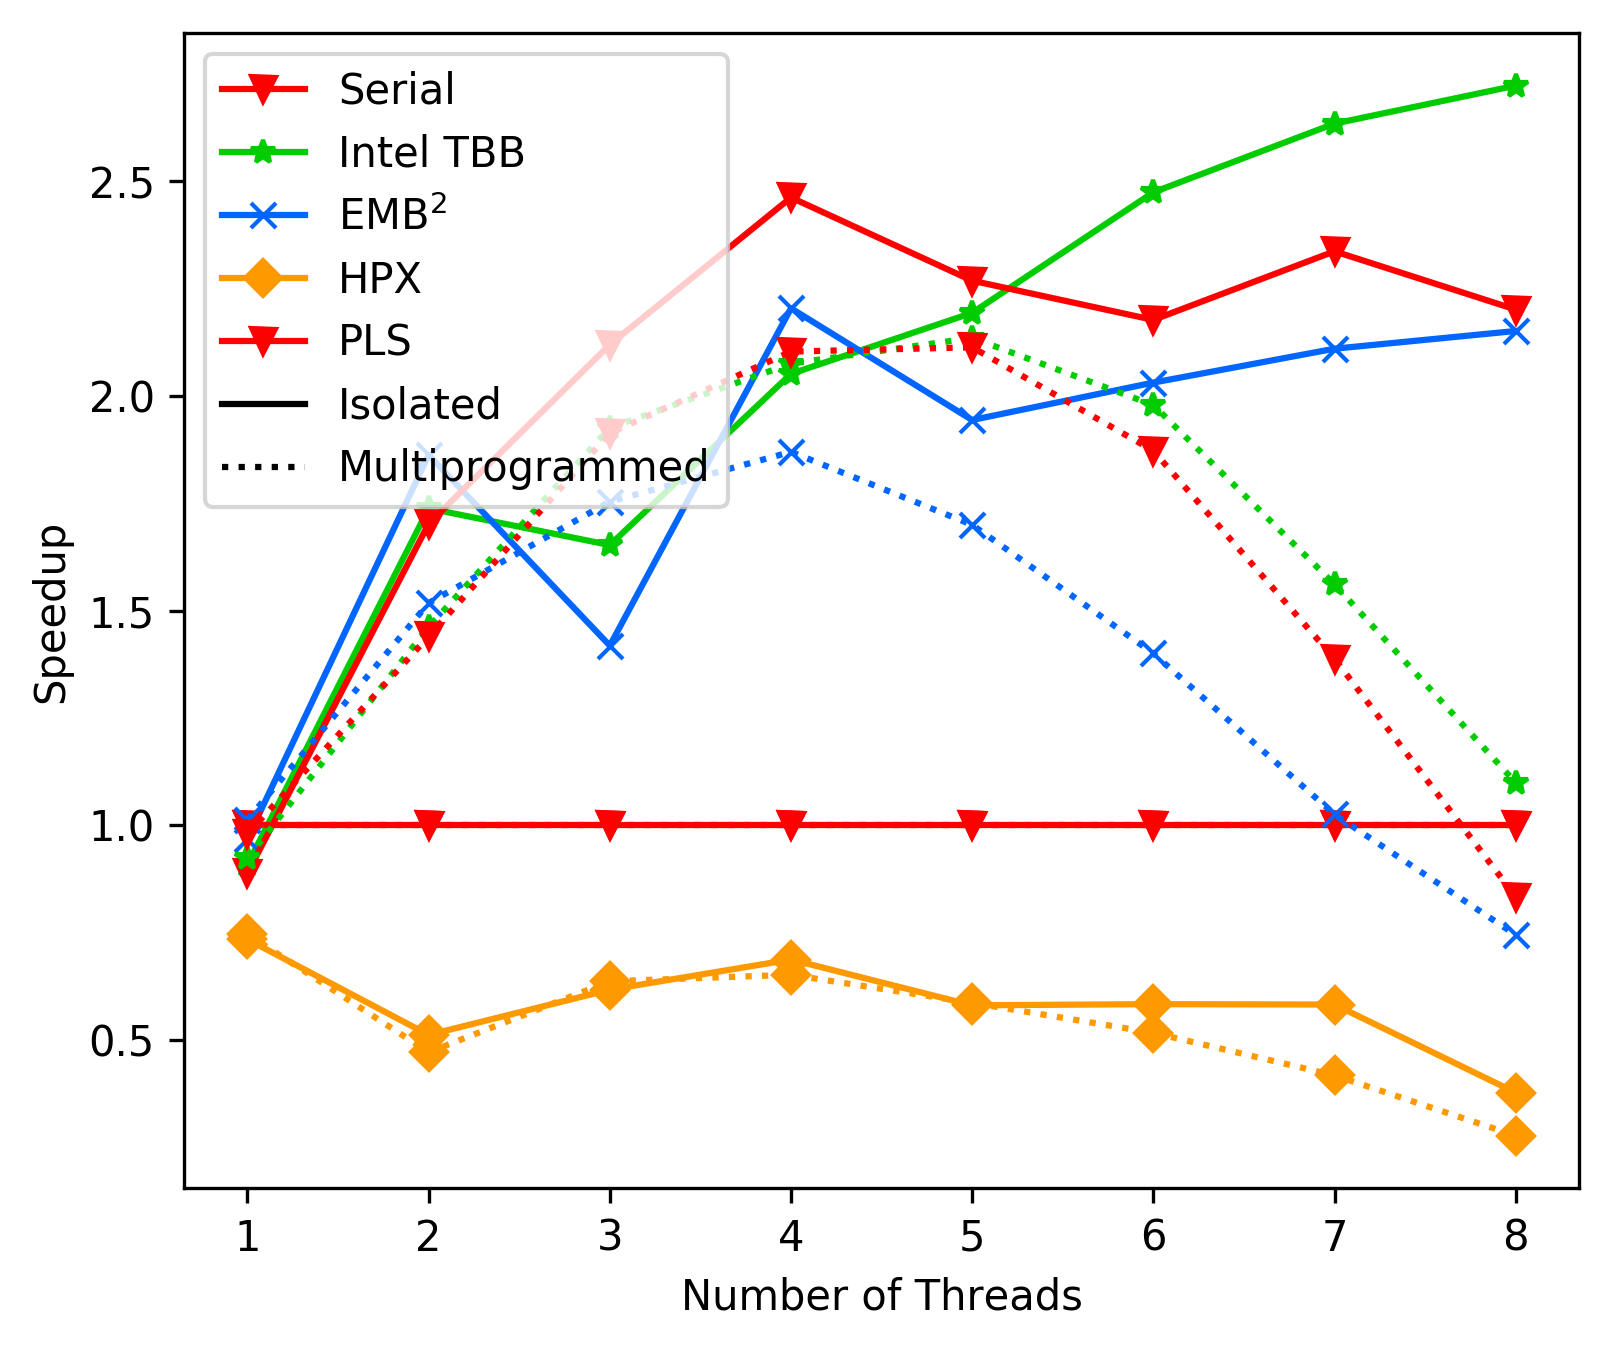
FFT Average:
We observe solid performance from our implementation.
(Again, not very scientific test environment, but good enough for
our general direction)
### Commit 3bdaba42 - Move to pure fork-join tasks (remove two level)
We moved away from our two-level scheduler approach towards a
pure fork-join task model (in order to remove any lock's in the
code more easily and to make further tests simpler/more focused
on one specific aspecs.
These are the measurements made after the change
(without any performance optimizations done):
FFT Average:
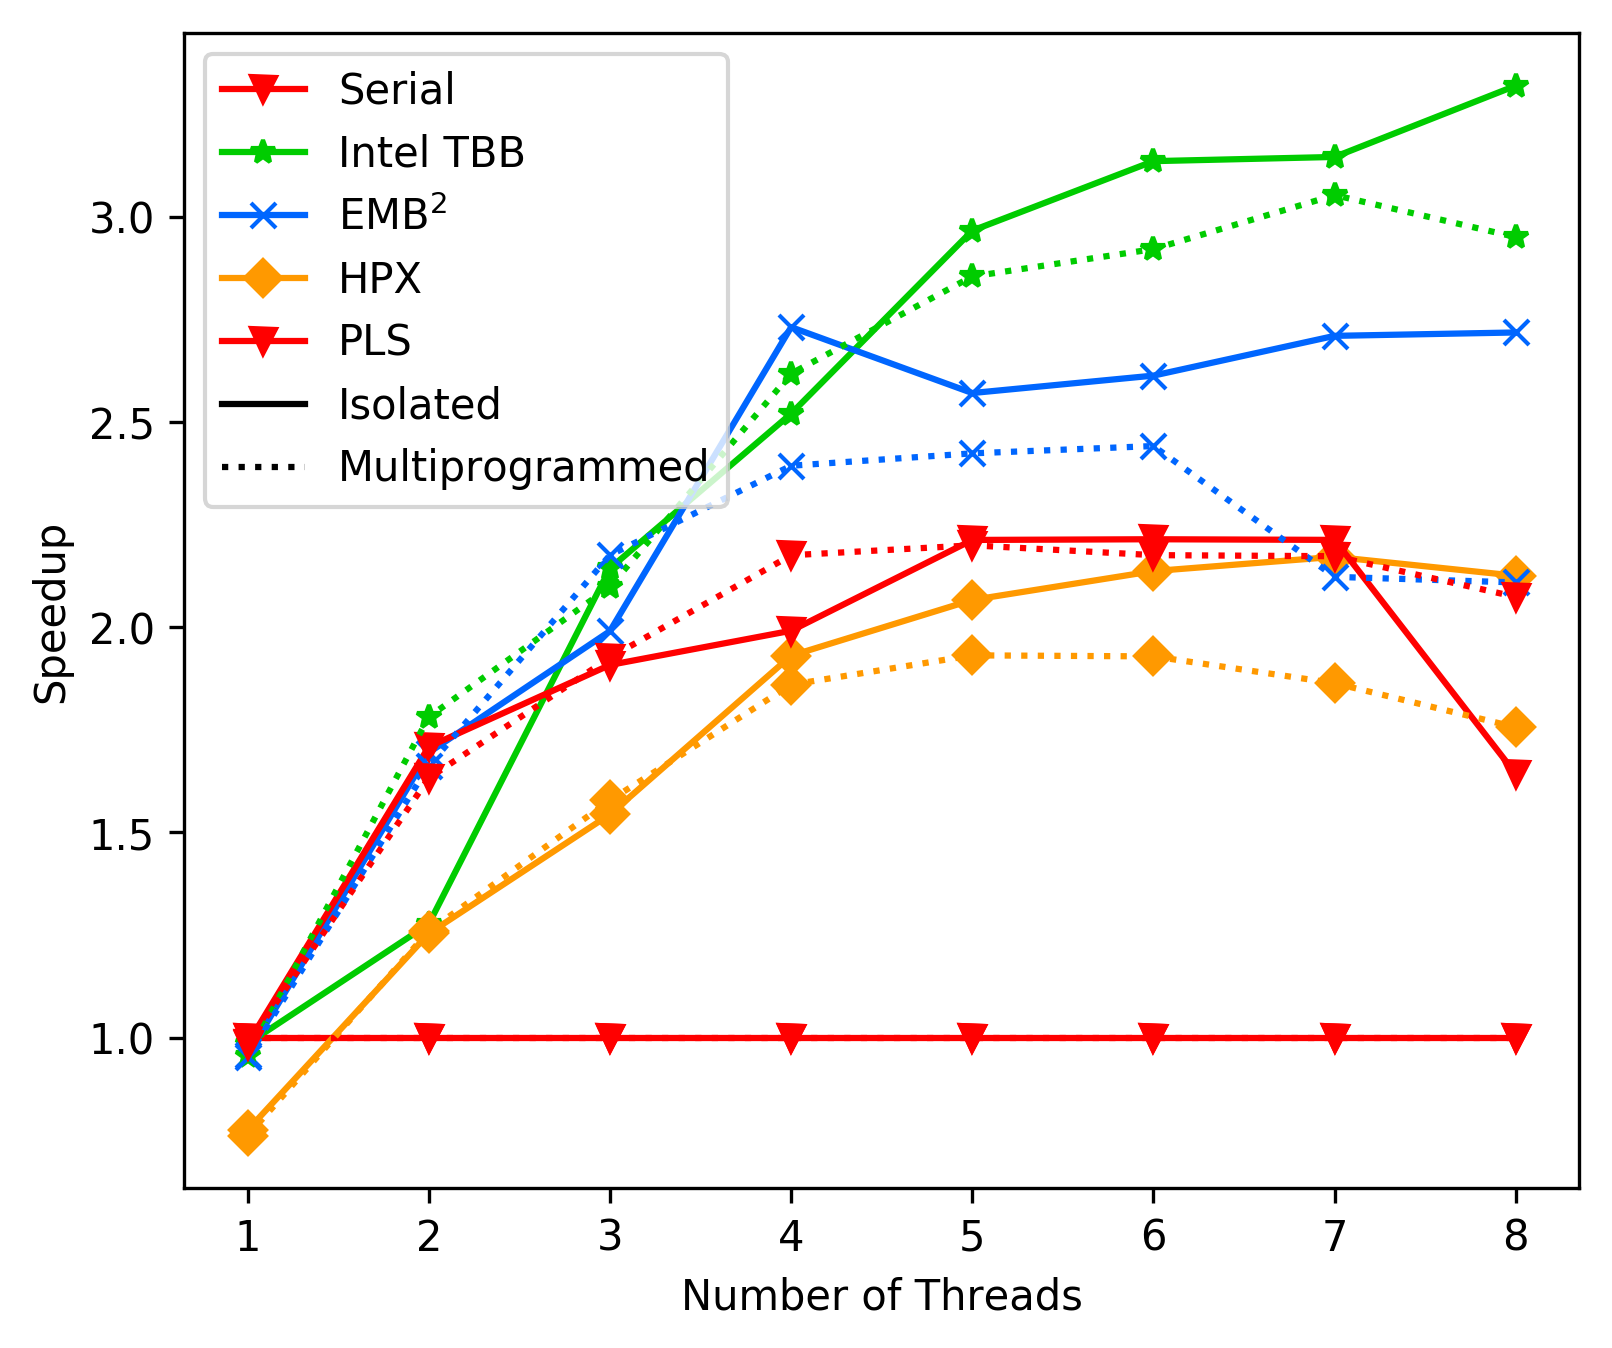
 Heat Diffusion Average:
 Matrix Multiplication Average:
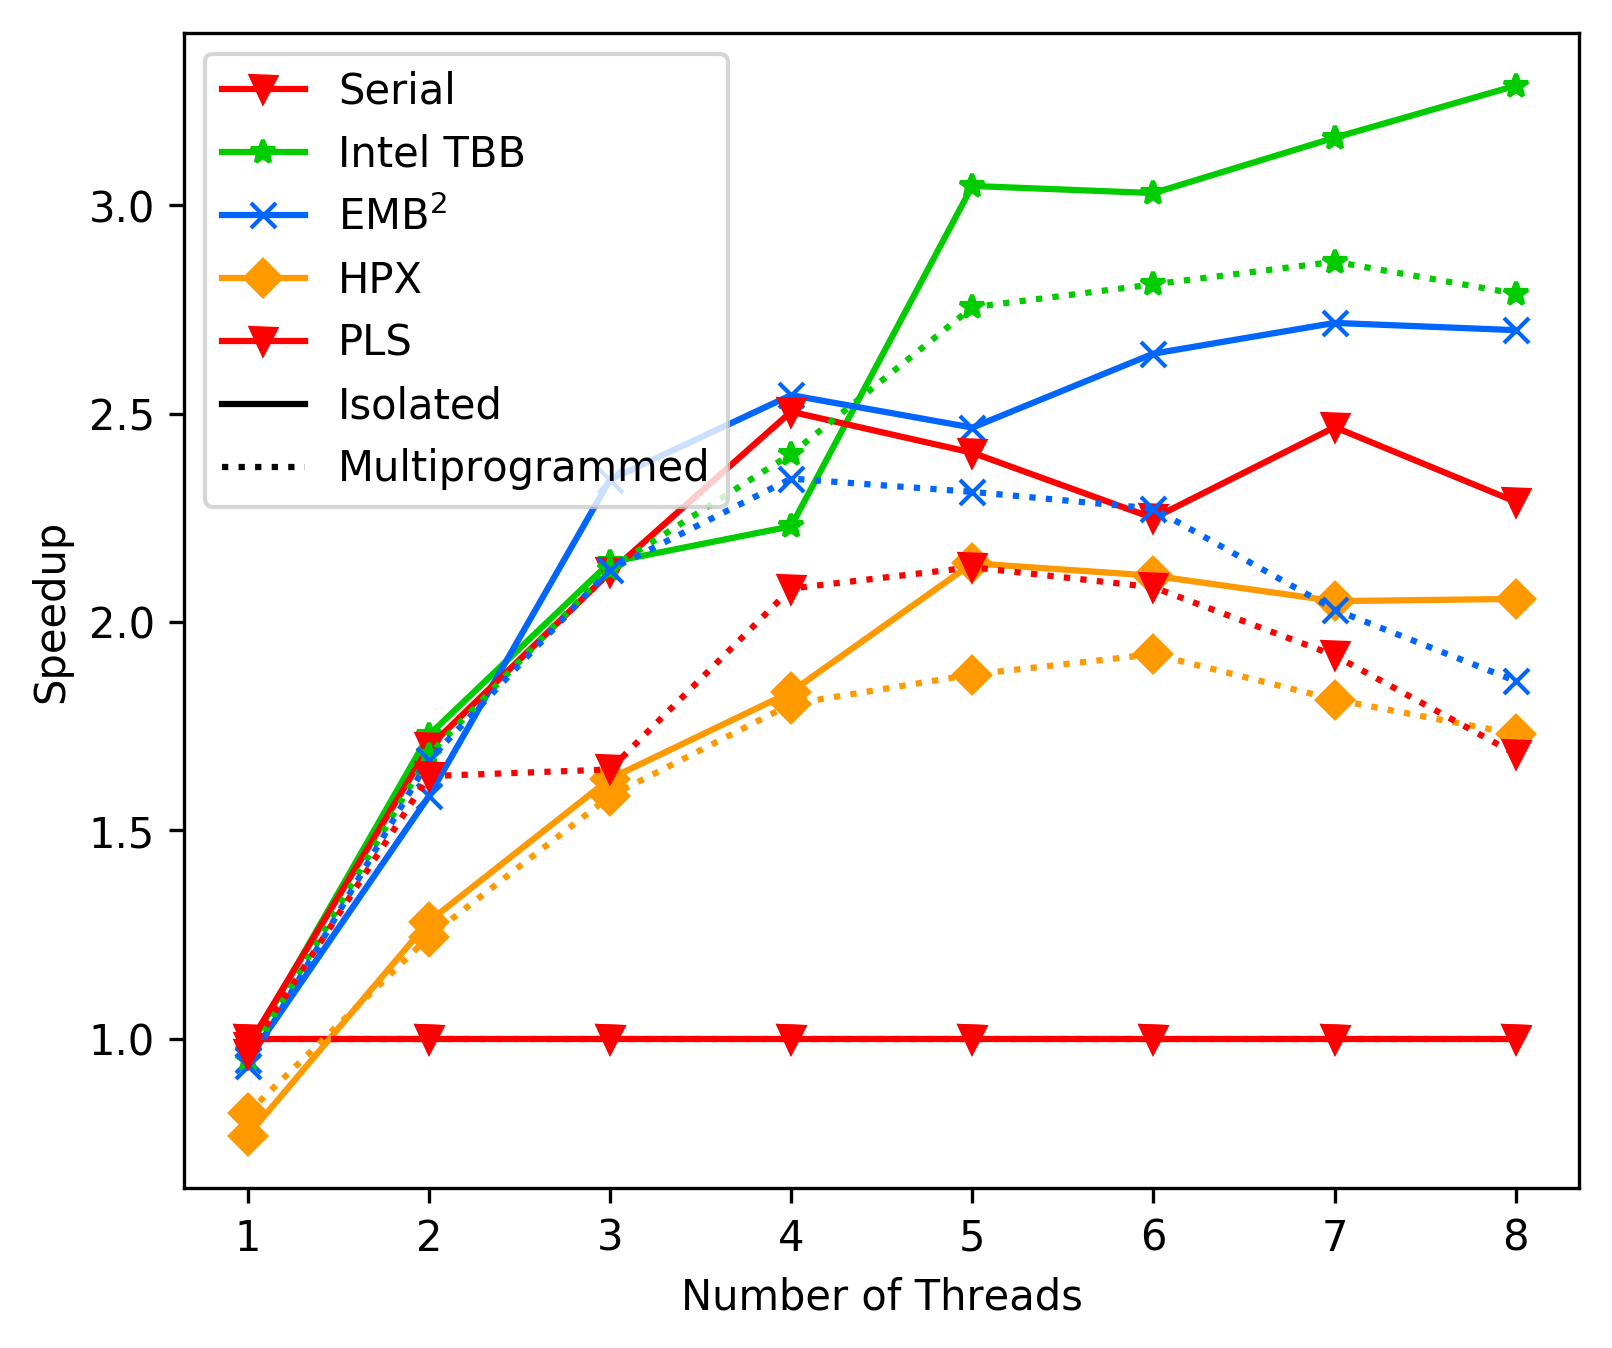
 Unbalanced Tree Search Average:
 We note that in heat diffusion, matrix multiplication and unbalanced
tree search - all three benchmarks with mostly enough work avaliable at
all time - our implementation performs head on head with intel's
TBB. Only the FFT benchmark is a major problem four our library.
We notice a MAJOR drop in performance exactly at the hyperthreading
mark, indicating problems with limited resources due to the spinning
threads (threads without any actual work) and the threads actually
performing work. Most likely there is a resource on the same cache
line used that hinders the working threads, but we can not really
figure out which one it is.
We note that in heat diffusion, matrix multiplication and unbalanced
tree search - all three benchmarks with mostly enough work avaliable at
all time - our implementation performs head on head with intel's
TBB. Only the FFT benchmark is a major problem four our library.
We notice a MAJOR drop in performance exactly at the hyperthreading
mark, indicating problems with limited resources due to the spinning
threads (threads without any actual work) and the threads actually
performing work. Most likely there is a resource on the same cache
line used that hinders the working threads, but we can not really
figure out which one it is.